Mathematical modelling is a tool to uncover relationships about observable quantities in the real-world. Consider a model for bacterial growth rate given by the linear equation y = mx + b where is the population size in cells and y is the growth rate. m and b are the slope and intercept respectively. Often in real life, data has noise and may not follow theoretical relationships exactly. For a given data point (x, y) we define the error between the data and the linear model as Ci = yi (mx; + b), noting that if the data matches the line perfectly then the error is zero. If we can't find an exact linear relationship then our objective is to find the best line we can. One method for doing this is called the method of least squares which minimizes the total square error,
Mathematical modelling is a tool to uncover relationships about observable quantities in the real-world. Consider a model for bacterial growth rate given by the linear equation y = mx + b where is the population size in cells and y is the growth rate. m and b are the slope and intercept respectively. Often in real life, data has noise and may not follow theoretical relationships exactly. For a given data point (x, y) we define the error between the data and the linear model as Ci = yi (mx; + b), noting that if the data matches the line perfectly then the error is zero. If we can't find an exact linear relationship then our objective is to find the best line we can. One method for doing this is called the method of least squares which minimizes the total square error,

Algebra & Trigonometry with Analytic Geometry
13th Edition
ISBN:9781133382119
Author:Swokowski
Publisher:Swokowski
Chapter7: Analytic Trigonometry
Section7.6: The Inverse Trigonometric Functions
Problem 93E

Related questions
Question
Please solve all parts

Transcribed Image Text:(c) Show that the two conditions that lead to the minimum square error for a general set of
data (x, y) are
n
n
n
Σviyi = m Σx ² + b[xi, Yi = m
i=1
i=1
i=1
i=1
n
Σxi + bn.
(d) Determine an equation of the line of best fit using (c) for the data provided. Using Excel
or some other software plot the data along with the line you computed demonstrating
that it is a good fit.
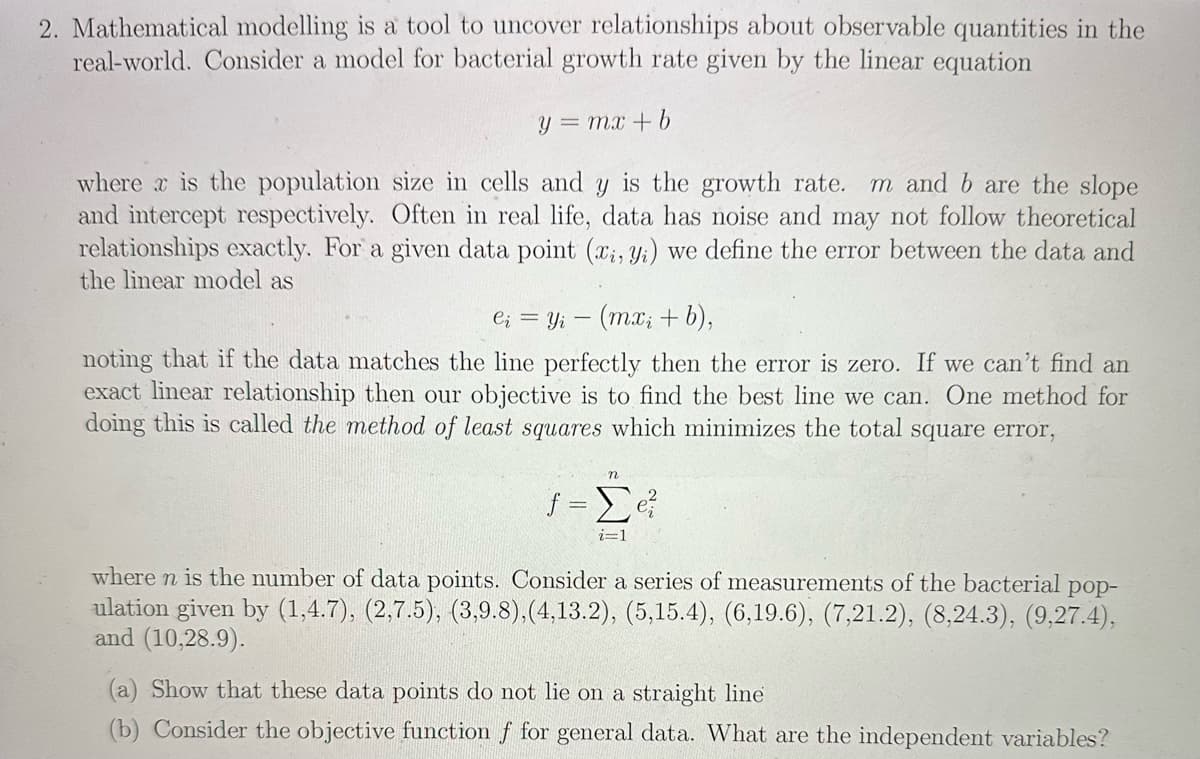
Transcribed Image Text:2. Mathematical modelling is a tool to uncover relationships about observable quantities in the
real-world. Consider a model for bacterial growth rate given by the linear equation
y = mx + b
where x is the population size in cells and y is the growth rate. m and b are the slope
and intercept respectively. Often in real life, data has noise and may not follow theoretical
relationships exactly. For a given data point (x, y) we define the error between the data and
the linear model as
ei = yi (mxi + b),
-
noting that if the data matches the line perfectly then the error is zero. If we can't find an
exact linear relationship then our objective is to find the best line we can. One method for
doing this is called the method of least squares which minimizes the total square error,
n
f=Σe²
i=1
where n is the number of data points. Consider a series of measurements of the bacterial pop-
ulation given by (1,4.7), (2,7.5), (3,9.8),(4,13.2), (5,15.4), (6,19.6), (7,21.2), (8,24.3), (9,27.4),
and (10,28.9).
(a) Show that these data points do not lie on a straight line
(b) Consider the objective function f for general data. What are the independent variables?
Expert Solution
This question has been solved!
Explore an expertly crafted, step-by-step solution for a thorough understanding of key concepts.

Step by step
Solved in 4 steps with 1 images

Recommended textbooks for you
Algebra & Trigonometry with Analytic Geometry
Algebra
ISBN:
9781133382119
Author:
Swokowski
Publisher:
Cengage

Algebra and Trigonometry (MindTap Course List)
Algebra
ISBN:
9781305071742
Author:
James Stewart, Lothar Redlin, Saleem Watson
Publisher:
Cengage Learning
Algebra & Trigonometry with Analytic Geometry
Algebra
ISBN:
9781133382119
Author:
Swokowski
Publisher:
Cengage
Algebra and Trigonometry (MindTap Course List)
Algebra
ISBN:
9781305071742
Author:
James Stewart, Lothar Redlin, Saleem Watson
Publisher:
Cengage Learning