mathxl.com/Student/PlayerHomework.aspx?homeworkld=616379615&questionld=18&flushed=false&cld=6801150¢erwin=yes Econ I Fall 2021 Intersession THU TRANG 12/21/21 8:11 AM Question 13, Checkpoint 2 Test B 3 E Homework: Chapter 4: Supply and Demand (Copy) HW Score: 0%, O of 30 points O Points: 0 of 1 Save Part 1 of 2 The graph shows the supply curve of tacos. Price (dollars per taco) 10- Draw an arrow to show what happens to firms' plans if the price of a taco rises but all other influences on selling plans remain the ame 8- Quantity (tacos per day) >>> Draw only the objects specified in the question. Animation Etext pages Get more help - Clear all Check answer 812 AM P Type here to search 41°F Mostly cloudy 12/21/2021
mathxl.com/Student/PlayerHomework.aspx?homeworkld=616379615&questionld=18&flushed=false&cld=6801150¢erwin=yes Econ I Fall 2021 Intersession THU TRANG 12/21/21 8:11 AM Question 13, Checkpoint 2 Test B 3 E Homework: Chapter 4: Supply and Demand (Copy) HW Score: 0%, O of 30 points O Points: 0 of 1 Save Part 1 of 2 The graph shows the supply curve of tacos. Price (dollars per taco) 10- Draw an arrow to show what happens to firms' plans if the price of a taco rises but all other influences on selling plans remain the ame 8- Quantity (tacos per day) >>> Draw only the objects specified in the question. Animation Etext pages Get more help - Clear all Check answer 812 AM P Type here to search 41°F Mostly cloudy 12/21/2021

Chapter9: Production Functions
Section: Chapter Questions
Problem 9.6P

Related questions
Question
Transcribed Image Text:P Do Homework - Chapter 4: Supply and Demand (Copy) - Google Chrome
A mathxl.com/Student/PlayerHomework.aspx?homeworkld=616379615&questionld=1&flushed=false&cld=6801150¢erwin=yes
Econ I Fall 2021 Intersession
THU TRANG
12/21/21 8:11 AM
= Homework: Chapter 4: Supply and Demand (Copy)
Question 13, Checkpoint 2 Test B 3
Part 1 of 2
HW Score: 0%, O of 30 points
O Points: 0 of 1
Save
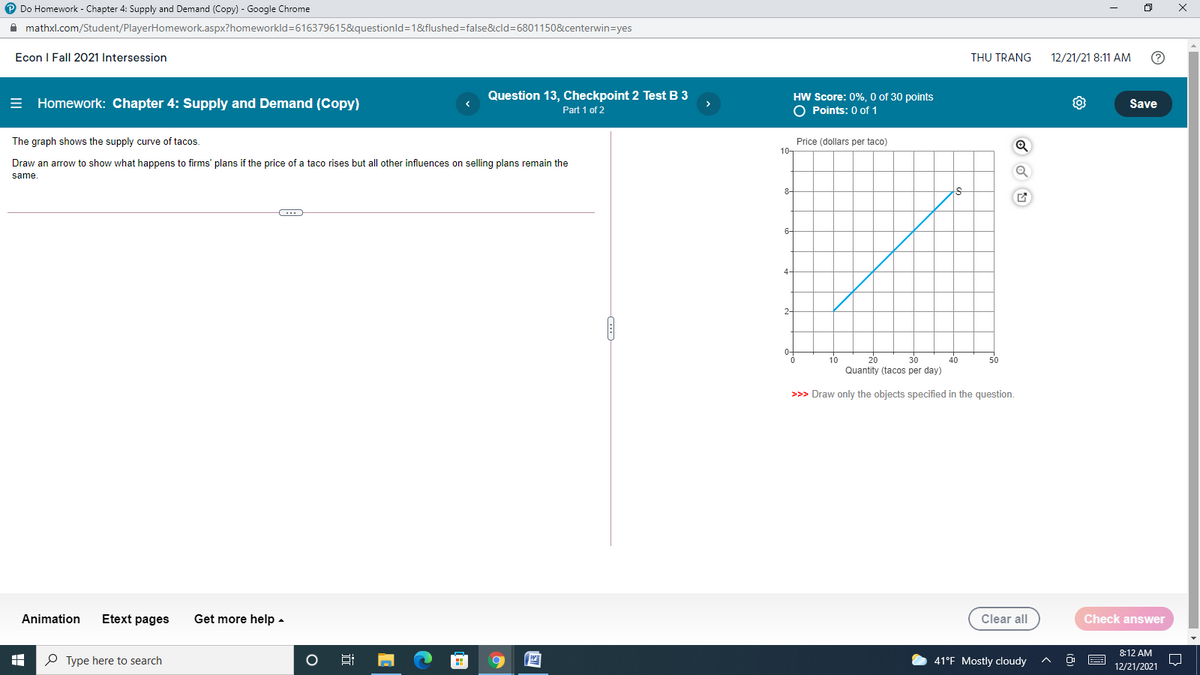
The graph shows the supply curve of tacos.
Price (dollars per taco)
10-
Draw an arrow to show what happens to firms' plans if the price of a taco rises but all other influences on selling plans remain the
same.
8-
10
20
30
40
50
Quantity (tacos per day)
>>> Draw only the objects specified in the question.
Animation
Etext pages
Get more help -
Clear all
Check answer
8:12 AM
P Type here to search
WE
41°F Mostly cloudy
12/21/2021
Expert Solution
This question has been solved!
Explore an expertly crafted, step-by-step solution for a thorough understanding of key concepts.

This is a popular solution!

Trending now
This is a popular solution!

Step by step
Solved in 2 steps with 2 images

Knowledge Booster


Learn more about
Need a deep-dive on the concept behind this application? Look no further. Learn more about this topic, economics and related others by exploring similar questions and additional content below.Recommended textbooks for you

Managerial Economics: Applications, Strategies an…
Economics
ISBN:
9781305506381
Author:
James R. McGuigan, R. Charles Moyer, Frederick H.deB. Harris
Publisher:
Cengage Learning
Managerial Economics: Applications, Strategies an…
Economics
ISBN:
9781305506381
Author:
James R. McGuigan, R. Charles Moyer, Frederick H.deB. Harris
Publisher:
Cengage Learning