Mean density near Mean density far from P-value Species ruins (animals/km^2) ruins 160.2 14.5 Agouti Coatimundi Collared peccary 0.03 99.4 1.0 0.01 4.6 1.8 0.79 Deppes squirrel Howler monkey Spider monkey Crested guan 32.3 2.2 0.54 7.3 0.03 1.9 0.88 170.8 15.0 49.4 0.001 Great curassow 10.8 72.0 0.048 Ocellated turkey 47.0 0.02 Table 1 Tinamou 4.9 0.049 Tikal National Park in Guatemala is heavily visited by tourists. Does the disturbance affect animal densities? To investigate, Hidinger (1996) compared the densities of various bird and mammal species in places immediately next to heavily visited ruins to places in the park that were rarely visited by tourists. The mean densities (in animals/km^2) are found in the accompanying table. The table also lists the P-value associated with a test of the null hypothesis that the two types of plots do not differ in mean density. Assume that a = 0.05. Name ONE species from that table that shows a significant increase in density near heavily visited ruins? (yes or no) Is it a significant difference? For the spider monkey, does it appear to be a higher mean density near ruins? (yes or no) The species column represent what type of data? (nominal, ordinal, ratio or interval) (nominal, ordinal, ratio or interval) Is it discrete or continuous? Mean density represents what type of data? (discrete or continuous) What kind of graph would be the best way to display this data? (scatter plot, line graph, bar graph, histogram, heat map)
Mean density near Mean density far from P-value Species ruins (animals/km^2) ruins 160.2 14.5 Agouti Coatimundi Collared peccary 0.03 99.4 1.0 0.01 4.6 1.8 0.79 Deppes squirrel Howler monkey Spider monkey Crested guan 32.3 2.2 0.54 7.3 0.03 1.9 0.88 170.8 15.0 49.4 0.001 Great curassow 10.8 72.0 0.048 Ocellated turkey 47.0 0.02 Table 1 Tinamou 4.9 0.049 Tikal National Park in Guatemala is heavily visited by tourists. Does the disturbance affect animal densities? To investigate, Hidinger (1996) compared the densities of various bird and mammal species in places immediately next to heavily visited ruins to places in the park that were rarely visited by tourists. The mean densities (in animals/km^2) are found in the accompanying table. The table also lists the P-value associated with a test of the null hypothesis that the two types of plots do not differ in mean density. Assume that a = 0.05. Name ONE species from that table that shows a significant increase in density near heavily visited ruins? (yes or no) Is it a significant difference? For the spider monkey, does it appear to be a higher mean density near ruins? (yes or no) The species column represent what type of data? (nominal, ordinal, ratio or interval) (nominal, ordinal, ratio or interval) Is it discrete or continuous? Mean density represents what type of data? (discrete or continuous) What kind of graph would be the best way to display this data? (scatter plot, line graph, bar graph, histogram, heat map)

Biology: The Unity and Diversity of Life (MindTap Course List)
15th Edition
ISBN:9781337408332
Author:Cecie Starr, Ralph Taggart, Christine Evers, Lisa Starr
Publisher:Cecie Starr, Ralph Taggart, Christine Evers, Lisa Starr
Chapter44: Population Ecology
Section: Chapter Questions
Problem 2CT: Mountain gorillas are a highly endangered primate species, with 800 or so individuals surviving in...

Related questions

Question
This my third time posting the same question. Because no one answer it straight to me. Could you please tell me which of these choices is correct and Why.
Also could you please highlight the correct answer for each one
Transcribed Image Text:Mean density near
Mean density far from
P-value
Species
ruins (animals/km^2)
ruins
160.2
14.5
Agouti
Coatimundi
Collared peccary
0.03
99.4
1.0
0.01
4.6
1.8
0.79
Deppes squirrel
Howler monkey
Spider monkey
Crested guan
32.3
2.2
0.54
7.3
0.03
1.9
0.88
170.8
15.0
49.4
0.001
Great curassow
10.8
72.0
0.048
Ocellated turkey
47.0
0.02
Table 1
Tinamou
4.9
0.049
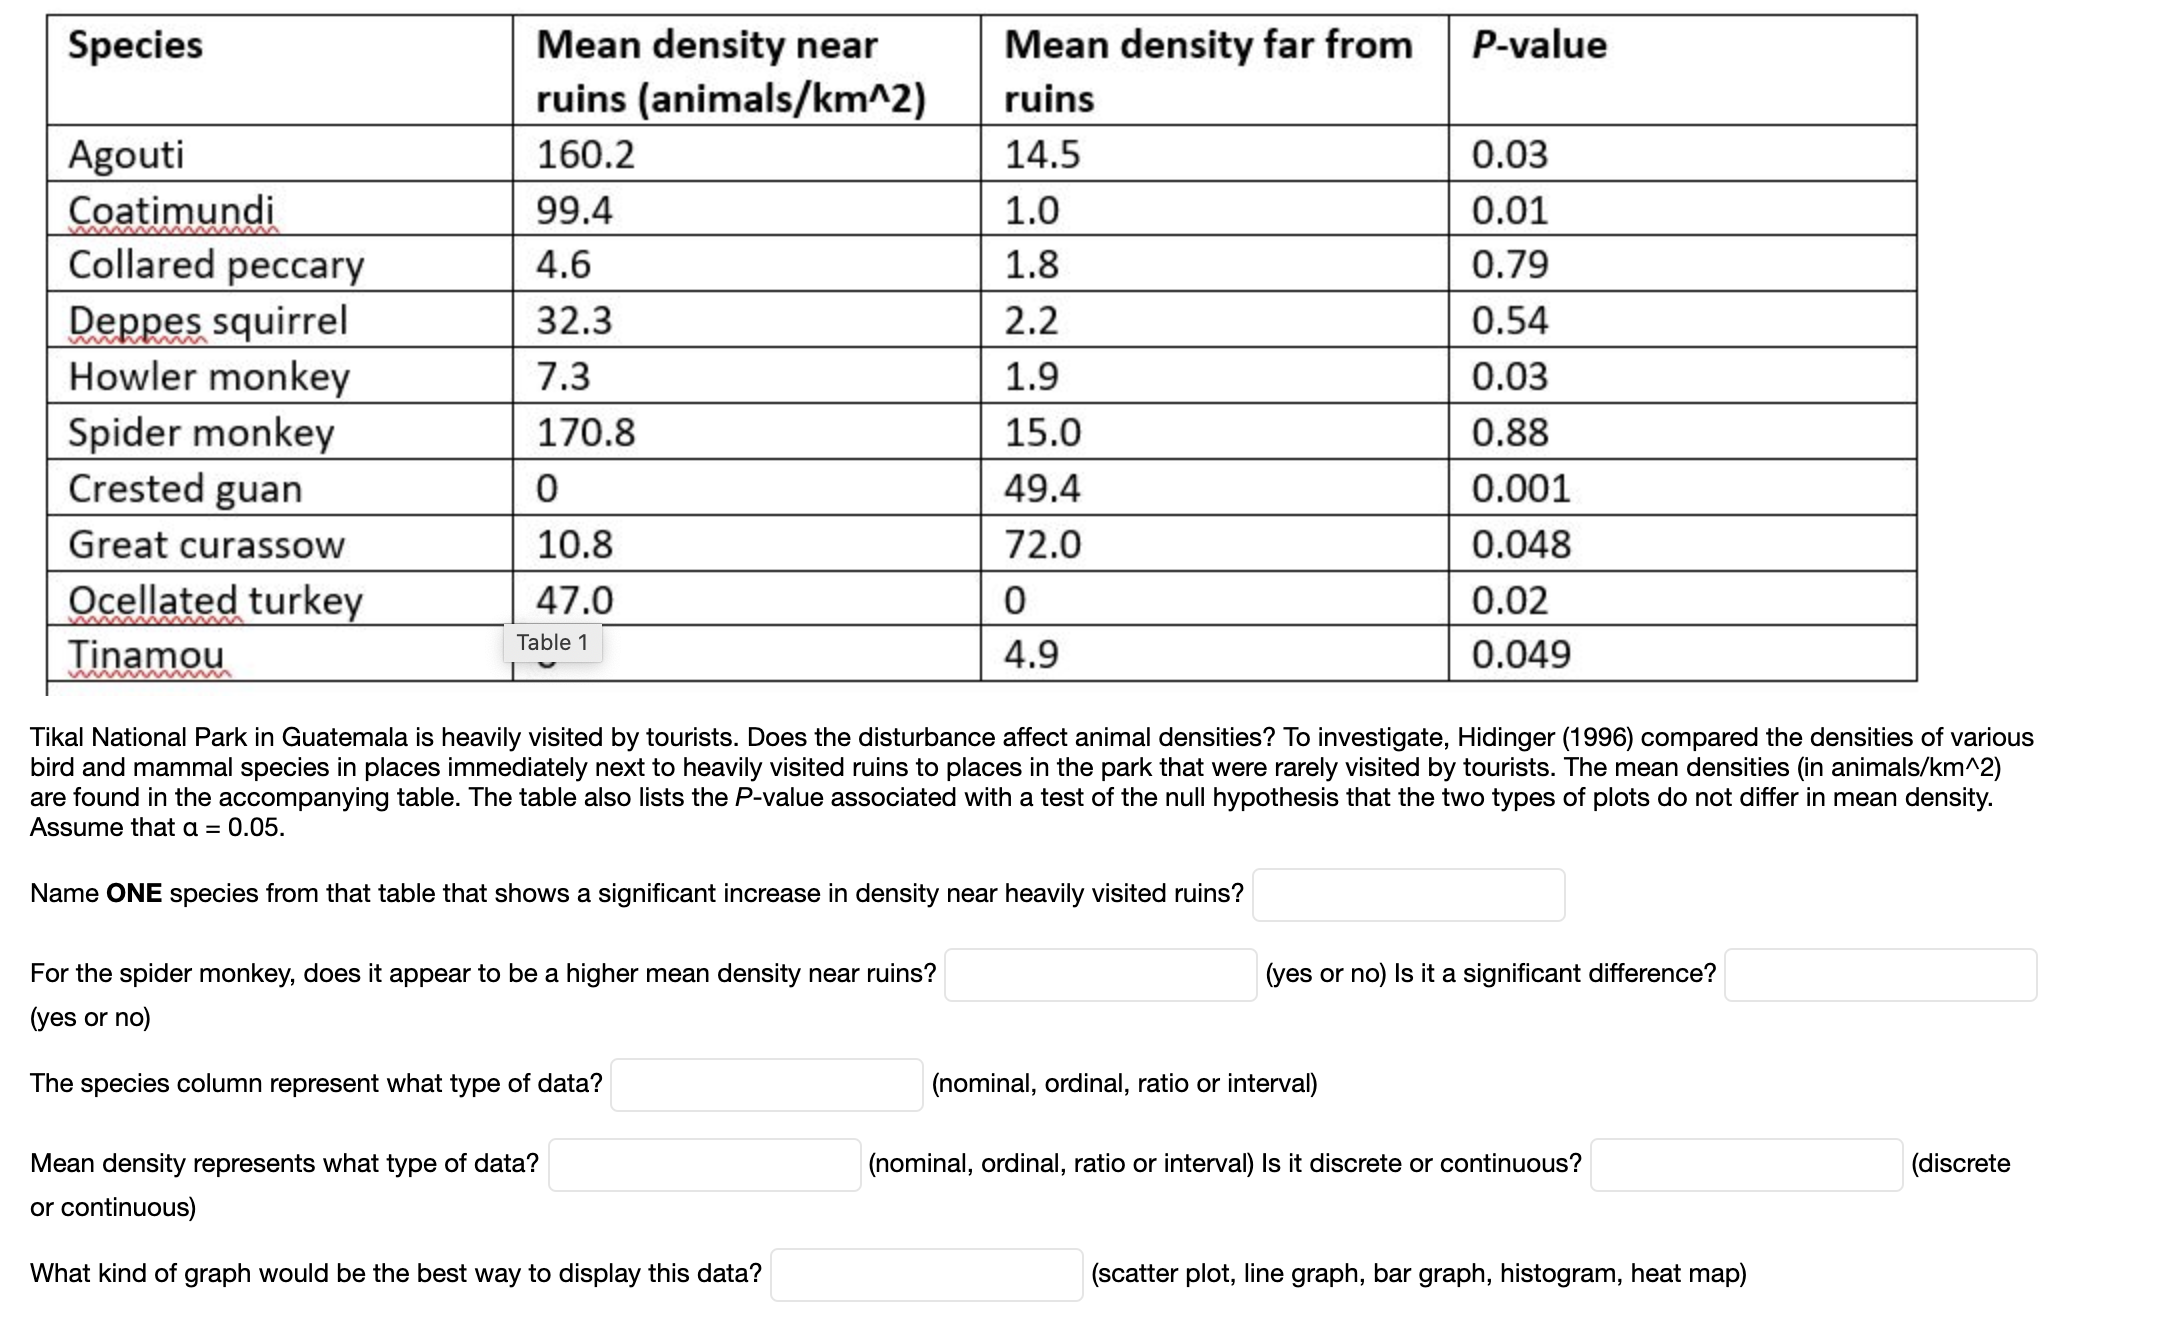
Tikal National Park in Guatemala is heavily visited by tourists. Does the disturbance affect animal densities? To investigate, Hidinger (1996) compared the densities of various
bird and mammal species in places immediately next to heavily visited ruins to places in the park that were rarely visited by tourists. The mean densities (in animals/km^2)
are found in the accompanying table. The table also lists the P-value associated with a test of the null hypothesis that the two types of plots do not differ in mean density.
Assume that a = 0.05.
Name ONE species from that table that shows a significant increase in density near heavily visited ruins?
(yes or no) Is it a significant difference?
For the spider monkey, does it appear to be a higher mean density near ruins?
(yes or no)
The species column represent what type of data?
(nominal, ordinal, ratio or interval)
(nominal, ordinal, ratio or interval) Is it discrete or continuous?
Mean density represents what type of data?
(discrete
or continuous)
What kind of graph would be the best way to display this data?
(scatter plot, line graph, bar graph, histogram, heat map)
Expert Solution
This question has been solved!
Explore an expertly crafted, step-by-step solution for a thorough understanding of key concepts.

This is a popular solution!

Trending now
This is a popular solution!

Step by step
Solved in 5 steps

Knowledge Booster


Learn more about
Need a deep-dive on the concept behind this application? Look no further. Learn more about this topic, biology and related others by exploring similar questions and additional content below.Recommended textbooks for you
Biology: The Unity and Diversity of Life (MindTap…
Biology
ISBN:
9781337408332
Author:
Cecie Starr, Ralph Taggart, Christine Evers, Lisa Starr
Publisher:
Cengage Learning

Biology: The Unity and Diversity of Life (MindTap…
Biology
ISBN:
9781337408332
Author:
Cecie Starr, Ralph Taggart, Christine Evers, Lisa Starr
Publisher:
Cengage Learning