
Principles of Physics: A Calculus-Based Text
5th Edition
ISBN:9781133104261
Author:Raymond A. Serway, John W. Jewett
Publisher:Raymond A. Serway, John W. Jewett
Chapter2: Motion In One Dimension
Section: Chapter Questions
Problem 23P: The driver of a car slams on the brakes when he sees a tree blocking the road. The car slows...

Related questions
Question
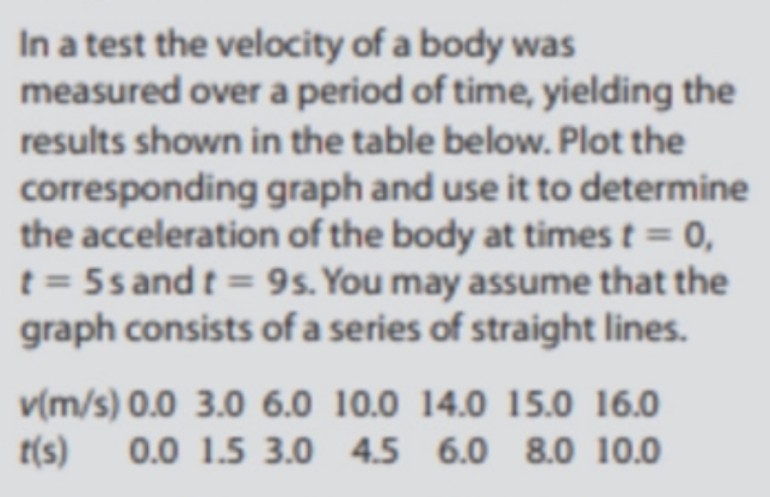
Transcribed Image Text:In a test the velocity of a body was
measured over a period of time, yielding the
results shown in the table below. Plot the
corresponding graph and use it to determine
the acceleration of the body at times t = 0,
t = 5s and t = 9s. You may assume that the
graph consists of a series of straight lines.
v(m/s) 0.0 3.0 6.0 10.0 14.0 15.0 16.0
t(s)
0.0 1.5 3.0 4.5 6.0 8.0 10.0
Expert Solution
This question has been solved!
Explore an expertly crafted, step-by-step solution for a thorough understanding of key concepts.

This is a popular solution!

Trending now
This is a popular solution!

Step by step
Solved in 4 steps with 2 images

Recommended textbooks for you
Principles of Physics: A Calculus-Based Text
Physics
ISBN:
9781133104261
Author:
Raymond A. Serway, John W. Jewett
Publisher:
Cengage Learning

Glencoe Physics: Principles and Problems, Student…
Physics
ISBN:
9780078807213
Author:
Paul W. Zitzewitz
Publisher:
Glencoe/McGraw-Hill
Principles of Physics: A Calculus-Based Text
Physics
ISBN:
9781133104261
Author:
Raymond A. Serway, John W. Jewett
Publisher:
Cengage Learning
Glencoe Physics: Principles and Problems, Student…
Physics
ISBN:
9780078807213
Author:
Paul W. Zitzewitz
Publisher:
Glencoe/McGraw-Hill