Methodology: • Based on the above information the consulting group will conduct ratio analysis for the following ratios: o Current ratio o Receivable's turnover o Times's interest earned O Profit margin o Days in inventory O Return on assets O Cash current debt coverage ratio As a next step the group will compare the ratios calculated above with industry benchmarks. The benchmarks are indicated within brackets besides each ratio. o Current ratio (3 to 1) o Receivable's turnover (13 times) o Times's interest earned (9 times) o o o O Profit margin (12%) Days in inventory (50 days) Return on assets (12%) Cash current debt coverage ratio (2 times)
Methodology: • Based on the above information the consulting group will conduct ratio analysis for the following ratios: o Current ratio o Receivable's turnover o Times's interest earned O Profit margin o Days in inventory O Return on assets O Cash current debt coverage ratio As a next step the group will compare the ratios calculated above with industry benchmarks. The benchmarks are indicated within brackets besides each ratio. o Current ratio (3 to 1) o Receivable's turnover (13 times) o Times's interest earned (9 times) o o o O Profit margin (12%) Days in inventory (50 days) Return on assets (12%) Cash current debt coverage ratio (2 times)

Survey of Accounting (Accounting I)
8th Edition
ISBN:9781305961883
Author:Carl Warren
Publisher:Carl Warren
Chapter1: The Role Of Accounting In Business
Section: Chapter Questions
Problem 1.17E: Financial statements Each of the following items is shown in the financial statements of ExxonMobil...

Related questions
Question
Methodology:
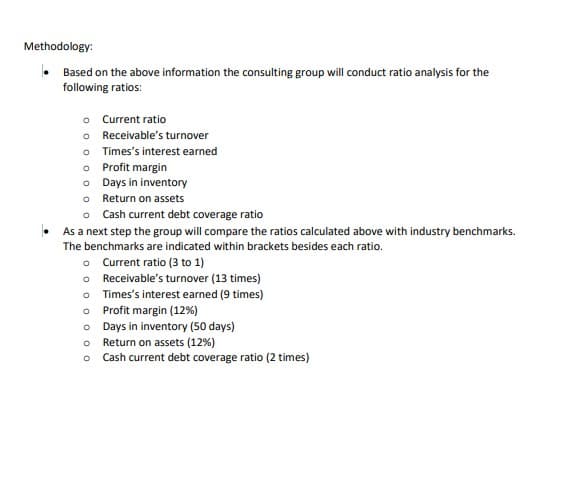
• Based on the above information the consulting group will conduct ratio analysis for the
following ratios:
o
o Receivable’s turnover
o Times’s interest earned
o Profit margin
o Days in inventory
o Return on assets
o Cash current debt coverage ratio
• As a next step the group will compare the ratios calculated above with industry benchmarks.
The benchmarks are indicated within brackets besides each ratio.
o Current ratio (3 to 1)
o Receivable’s turnover (13 times)
o Times’s interest earned (9 times)
o Profit margin (12%)
o Days in inventory (50 days)
o Return on assets (12%)
o Cash current debt coverage ratio (2 times
Transcribed Image Text:Methodology:
• Based on the above information the consulting group will conduct ratio analysis for the
following ratios:
o Current ratio
o Receivable's turnover
o Times's interest earned
o
o
Profit margin
Days in inventory
o Return on assets
o Cash current debt coverage ratio
As a next step the group will compare the ratios calculated
The benchmarks are indicated within brackets besides each ratio.
o
Current ratio (3 to 1)
o
Receivable's turnover (13 times)
o Times's interest earned (9 times)
o
o
O
O
Profit margin (12%)
Days in inventory (50 days)
Return on assets (12%)
Cash current debt coverage ratio (2 times)
with industry benchmarks.
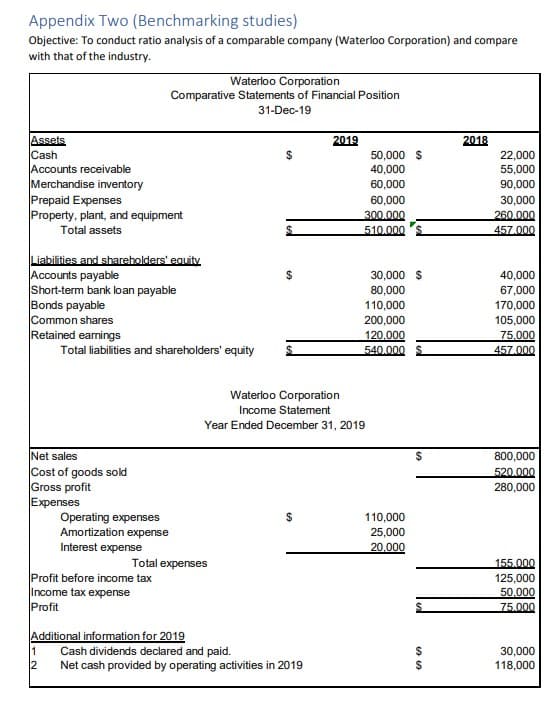
Transcribed Image Text:Appendix Two (Benchmarking studies)
Objective: To conduct ratio analysis of a comparable company (Waterloo Corporation) and compare
with that of the industry.
Assets
Cash
Accounts receivable
Merchandise inventory
Prepaid Expenses
Property, plant, and equipment
Total assets
Waterloo Corporation
Comparative Statements of Financial Position
31-Dec-19
Liabilities and shareholders' equity
Accounts payable
Short-term bank loan payable
Bonds payable
Common shares
Retained earnings
Total liabilities and shareholders' equity
Net sales
Cost of goods sold
Gross profit
Expenses
Operating expenses
Amortization expense
Interest expense
Profit before income tax
Income tax expense
Profit
Total expenses
Additional information for 2019
60
$
$
$
2019
Waterloo Corporation
Income Statement
Year Ended December 31, 2019
1
Cash dividends declared and paid.
2 Net cash provided by operating activities in 2019
50,000 $
40,000
60,000
60,000
300.000
510.000
30,000 $
80,000
110,000
200,000
120,000
540.000
110,000
25,000
20,000
$
6969
$
2018
22,000
55,000
90,000
30,000
260.000
457.000
40,000
67,000
170,000
105,000
75,000
457.000
800,000
520.000
280,000
155.000
125,000
50.000
75.000
30,000
118,000
Expert Solution
This question has been solved!
Explore an expertly crafted, step-by-step solution for a thorough understanding of key concepts.

Step by step
Solved in 2 steps with 1 images

Knowledge Booster


Learn more about
Need a deep-dive on the concept behind this application? Look no further. Learn more about this topic, accounting and related others by exploring similar questions and additional content below.Recommended textbooks for you
Survey of Accounting (Accounting I)
Accounting
ISBN:
9781305961883
Author:
Carl Warren
Publisher:
Cengage Learning

Financial Accounting: The Impact on Decision Make…
Accounting
ISBN:
9781305654174
Author:
Gary A. Porter, Curtis L. Norton
Publisher:
Cengage Learning

Survey of Accounting (Accounting I)
Accounting
ISBN:
9781305961883
Author:
Carl Warren
Publisher:
Cengage Learning
Financial Accounting: The Impact on Decision Make…
Accounting
ISBN:
9781305654174
Author:
Gary A. Porter, Curtis L. Norton
Publisher:
Cengage Learning

Cornerstones of Financial Accounting
Accounting
ISBN:
9781337690881
Author:
Jay Rich, Jeff Jones
Publisher:
Cengage Learning

Financial Accounting
Accounting
ISBN:
9781337272124
Author:
Carl Warren, James M. Reeve, Jonathan Duchac
Publisher:
Cengage Learning

Intermediate Accounting: Reporting And Analysis
Accounting
ISBN:
9781337788281
Author:
James M. Wahlen, Jefferson P. Jones, Donald Pagach
Publisher:
Cengage Learning