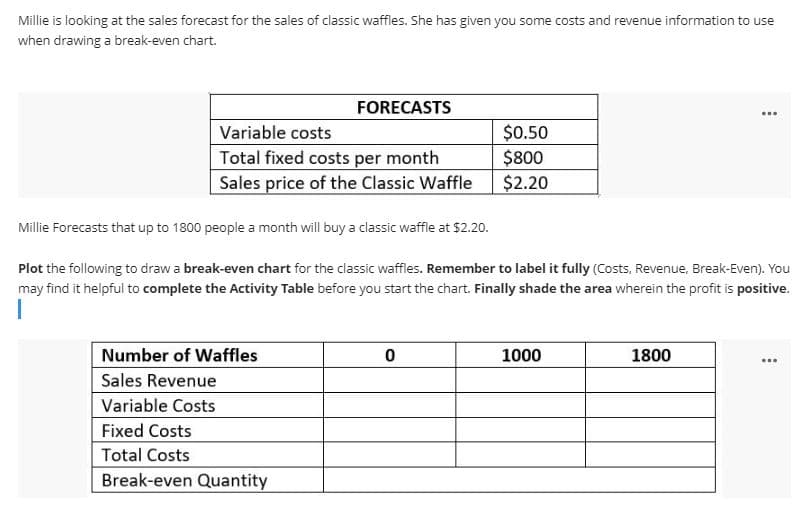
Millie is looking at the sales forecast for the sales of classic waffles. She has given you some costs and revenue information to use when drawing a break-even chart. FORECASTS ... Variable costs Total fixed costs per month Sales price of the Classic Waffle $0.50 $800 $2.20 Millie Forecasts that up to 1800 people a month will buy a classic waffle at $2.20. Plot the following to draw a break-even chart for the classic waffles. Remember to label it fully (Costs, Revenue, Break-Even). You may find it helpful to complete the Activity Table before you start the chart. Finally shade the area wherein the profit is positive. Number of Waffles 1000 1800 Sales Revenue Variable Costs Fixed Costs Total Costs Break-even Quantity
Millie is looking at the sales forecast for the sales of classic waffles. She has given you some costs and revenue information to use when drawing a break-even chart. FORECASTS ... Variable costs Total fixed costs per month Sales price of the Classic Waffle $0.50 $800 $2.20 Millie Forecasts that up to 1800 people a month will buy a classic waffle at $2.20. Plot the following to draw a break-even chart for the classic waffles. Remember to label it fully (Costs, Revenue, Break-Even). You may find it helpful to complete the Activity Table before you start the chart. Finally shade the area wherein the profit is positive. Number of Waffles 1000 1800 Sales Revenue Variable Costs Fixed Costs Total Costs Break-even Quantity

Excel Applications for Accounting Principles
4th Edition
ISBN:9781111581565
Author:Gaylord N. Smith
Publisher:Gaylord N. Smith
ChapterMB: Model-building Problems
Section: Chapter Questions
Problem 18M

Related questions
Question
Transcribed Image Text:Millie is looking at the sales forecast for the sales of classic waffles. She has given you some costs and revenue information to use
when drawing a break-even chart.
FORECASTS
...
Variable costs
Total fixed costs per month
Sales price of the Classic Waffle
$0.50
$800
$2.20
Millie Forecasts that up to 1800 people a month will buy a classic waffle at $2.20.
Plot the following to draw a break-even chart for the classic waffles. Remember to label it fully (Costs, Revenue, Break-Even). You
may find it helpful to complete the Activity Table before you start the chart. Finally shade the area wherein the profit is positive.
Number of Waffles
1000
1800
...
Sales Revenue
Variable Costs
Fixed Costs
Total Costs
Break-even Quantity
Expert Solution
This question has been solved!
Explore an expertly crafted, step-by-step solution for a thorough understanding of key concepts.

This is a popular solution!

Trending now
This is a popular solution!

Step by step
Solved in 3 steps with 2 images

Knowledge Booster


Learn more about
Need a deep-dive on the concept behind this application? Look no further. Learn more about this topic, accounting and related others by exploring similar questions and additional content below.Recommended textbooks for you
Excel Applications for Accounting Principles
Accounting
ISBN:
9781111581565
Author:
Gaylord N. Smith
Publisher:
Cengage Learning

Cornerstones of Cost Management (Cornerstones Ser…
Accounting
ISBN:
9781305970663
Author:
Don R. Hansen, Maryanne M. Mowen
Publisher:
Cengage Learning

Managerial Accounting: The Cornerstone of Busines…
Accounting
ISBN:
9781337115773
Author:
Maryanne M. Mowen, Don R. Hansen, Dan L. Heitger
Publisher:
Cengage Learning
Excel Applications for Accounting Principles
Accounting
ISBN:
9781111581565
Author:
Gaylord N. Smith
Publisher:
Cengage Learning
Cornerstones of Cost Management (Cornerstones Ser…
Accounting
ISBN:
9781305970663
Author:
Don R. Hansen, Maryanne M. Mowen
Publisher:
Cengage Learning
Managerial Accounting: The Cornerstone of Busines…
Accounting
ISBN:
9781337115773
Author:
Maryanne M. Mowen, Don R. Hansen, Dan L. Heitger
Publisher:
Cengage Learning

Principles of Accounting Volume 2
Accounting
ISBN:
9781947172609
Author:
OpenStax
Publisher:
OpenStax College

Essentials of Business Analytics (MindTap Course …
Statistics
ISBN:
9781305627734
Author:
Jeffrey D. Camm, James J. Cochran, Michael J. Fry, Jeffrey W. Ohlmann, David R. Anderson
Publisher:
Cengage Learning