MINITAB PRINTOUT Regression Analysis: SALES PER STORE versus DAILY HIGH TEMPE Predictor Constant DAILY HIGH TEMPERATURE (X) The regression equation is SALES PER STORE (Y) = 812 + 436 DAILY HIGH TEMPERATURE (X) 3= 2930.58 R-3q= 79.9% Analysis of Variance Accessibilite Unavailable 76 DE 436.32 Ses SE Seat 812 95 39800 R-9q (adj) = 78.80 Source Regression 648374033 163177395 Residual Error 19 Total 20 811551429 Pearson correlation of SALES PER STORE (Y) and DAILY HIGH TEMPERATURE (X) =0.894 P 4129 0.20 0.846 50.22 8.69 0.000 M3 F P 648374033 75.50 0.000 8588284
MINITAB PRINTOUT Regression Analysis: SALES PER STORE versus DAILY HIGH TEMPE Predictor Constant DAILY HIGH TEMPERATURE (X) The regression equation is SALES PER STORE (Y) = 812 + 436 DAILY HIGH TEMPERATURE (X) 3= 2930.58 R-3q= 79.9% Analysis of Variance Accessibilite Unavailable 76 DE 436.32 Ses SE Seat 812 95 39800 R-9q (adj) = 78.80 Source Regression 648374033 163177395 Residual Error 19 Total 20 811551429 Pearson correlation of SALES PER STORE (Y) and DAILY HIGH TEMPERATURE (X) =0.894 P 4129 0.20 0.846 50.22 8.69 0.000 M3 F P 648374033 75.50 0.000 8588284

Functions and Change: A Modeling Approach to College Algebra (MindTap Course List)
6th Edition
ISBN:9781337111348
Author:Bruce Crauder, Benny Evans, Alan Noell
Publisher:Bruce Crauder, Benny Evans, Alan Noell
Chapter3: Straight Lines And Linear Functions
Section3.CR: Chapter Review Exercises
Problem 16CR: XYZ Corporation Stock Prices The following table shows the average stock price, in dollars, of XYZ...

Related questions
Question
1. What is the linear regression equation on the Minitab printout?
2. What is the dependent variable?
3. What is the independent variable?
4. What is the coefficient of
5.What percentage of the variation in sales can be explained by the variation in temperature?
6. What is the slope and what does it mean in terms of this problem?
7. What is the y intercept and what does it mean in terms of this problem?
8. Conduct a hypothesis test to determine if there is
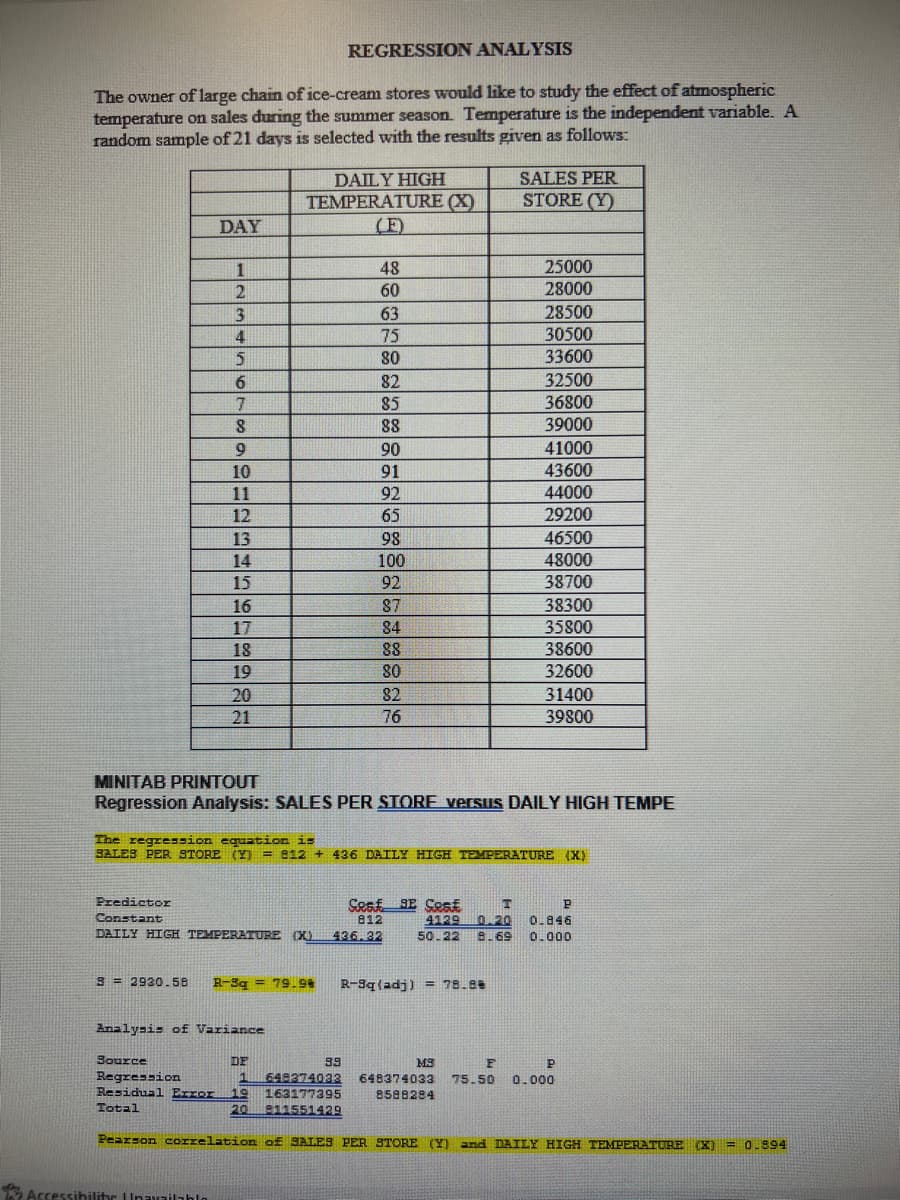
Transcribed Image Text:REGRESSION ANALYSIS
The owner of large chain of ice-cream stores would like to study the effect of atmospheric
temperature on sales during the summer season. Temperature is the independent variable. A
random sample of 21 days is selected with the results given as follows:
DAY
1
2
3
4
5
6
7
8
9
10
11
12
Source
Regression
Residual Error
Total
13
14
15
16
17
18
19
20
21
Accessibility Unavailable
DAILY HIGH
TEMPERATURE (X)
Predictor
Constant
DAILY HIGH TEMPERATURE (X)
3 2930.58 R-3g = 79.9%
Analysis of Variance
48
60
63
75
80
82
85
88
DF
1 648374033
163177395
20 811551429
90
91
92
65
9.5
98
100
92
87
84
88
80
82
76
MINITAB PRINTOUT
Regression Analysis: SALES PER STORE versus DAILY HIGH TEMPE
The regression equation is
SALES PER STORE (Y) = 812 + 436 DAILY HIGH TEMPERATURE (X)
436.32
Sest SE Seat
812
R-9q (adj) = 78.88
SALES PER
STORE (Y)
25000
28000
28500
30500
33600
32500
36800
39000
MS
41000
43600
44000
29200
46500
48000
38700
38300
35800
38600
32600
31400
39800
T
P
4129 0.20 0.846
50.22 8.69 0.000
F
P
648374033 75.50 0.000
8588284
Pearson correlation of SALES PER STORE (Y) and DAILY HIGH TEMPERATURE (X)
= 0.894
Expert Solution
This question has been solved!
Explore an expertly crafted, step-by-step solution for a thorough understanding of key concepts.

Step by step
Solved in 3 steps with 3 images

Recommended textbooks for you
Functions and Change: A Modeling Approach to Coll…
Algebra
ISBN:
9781337111348
Author:
Bruce Crauder, Benny Evans, Alan Noell
Publisher:
Cengage Learning

Algebra and Trigonometry (MindTap Course List)
Algebra
ISBN:
9781305071742
Author:
James Stewart, Lothar Redlin, Saleem Watson
Publisher:
Cengage Learning

Glencoe Algebra 1, Student Edition, 9780079039897…
Algebra
ISBN:
9780079039897
Author:
Carter
Publisher:
McGraw Hill
Functions and Change: A Modeling Approach to Coll…
Algebra
ISBN:
9781337111348
Author:
Bruce Crauder, Benny Evans, Alan Noell
Publisher:
Cengage Learning
Algebra and Trigonometry (MindTap Course List)
Algebra
ISBN:
9781305071742
Author:
James Stewart, Lothar Redlin, Saleem Watson
Publisher:
Cengage Learning
Glencoe Algebra 1, Student Edition, 9780079039897…
Algebra
ISBN:
9780079039897
Author:
Carter
Publisher:
McGraw Hill

Big Ideas Math A Bridge To Success Algebra 1: Stu…
Algebra
ISBN:
9781680331141
Author:
HOUGHTON MIFFLIN HARCOURT
Publisher:
Houghton Mifflin Harcourt

College Algebra
Algebra
ISBN:
9781305115545
Author:
James Stewart, Lothar Redlin, Saleem Watson
Publisher:
Cengage Learning

Algebra & Trigonometry with Analytic Geometry
Algebra
ISBN:
9781133382119
Author:
Swokowski
Publisher:
Cengage