MODUMA W Intro Stat Project 1.docx X https://oceancc-my.sharepoint.com/w:/r/personal/josephine ogr Search Getting Started Josephine O'Grady Documents Intro Stat Project 1 Saved References Insert Layout Review Help View Open in Desktop App Tell me what yc EE A A B I U A Ao Times New Ro 12 Frequency 8 I 6 6 4 4 4 2 1 O 2.5 8.5 14.5 20.5 26.5 32.5 38.5 44.5 Percentages of Teens Using Marijuana words English (U.S.) X 3 MacBook Air 2O F3 F8 O00 F6 F5 F7 F4 $ # & A 7 CO Ln tA


Contingency Table
A contingency table can be defined as the visual representation of the relationship between two or more categorical variables that can be evaluated and registered. It is a categorical version of the scatterplot, which is used to investigate the linear relationship between two variables. A contingency table is indeed a type of frequency distribution table that displays two variables at the same time.
Binomial Distribution
Binomial is an algebraic expression of the sum or the difference of two terms. Before knowing about binomial distribution, we must know about the binomial theorem.
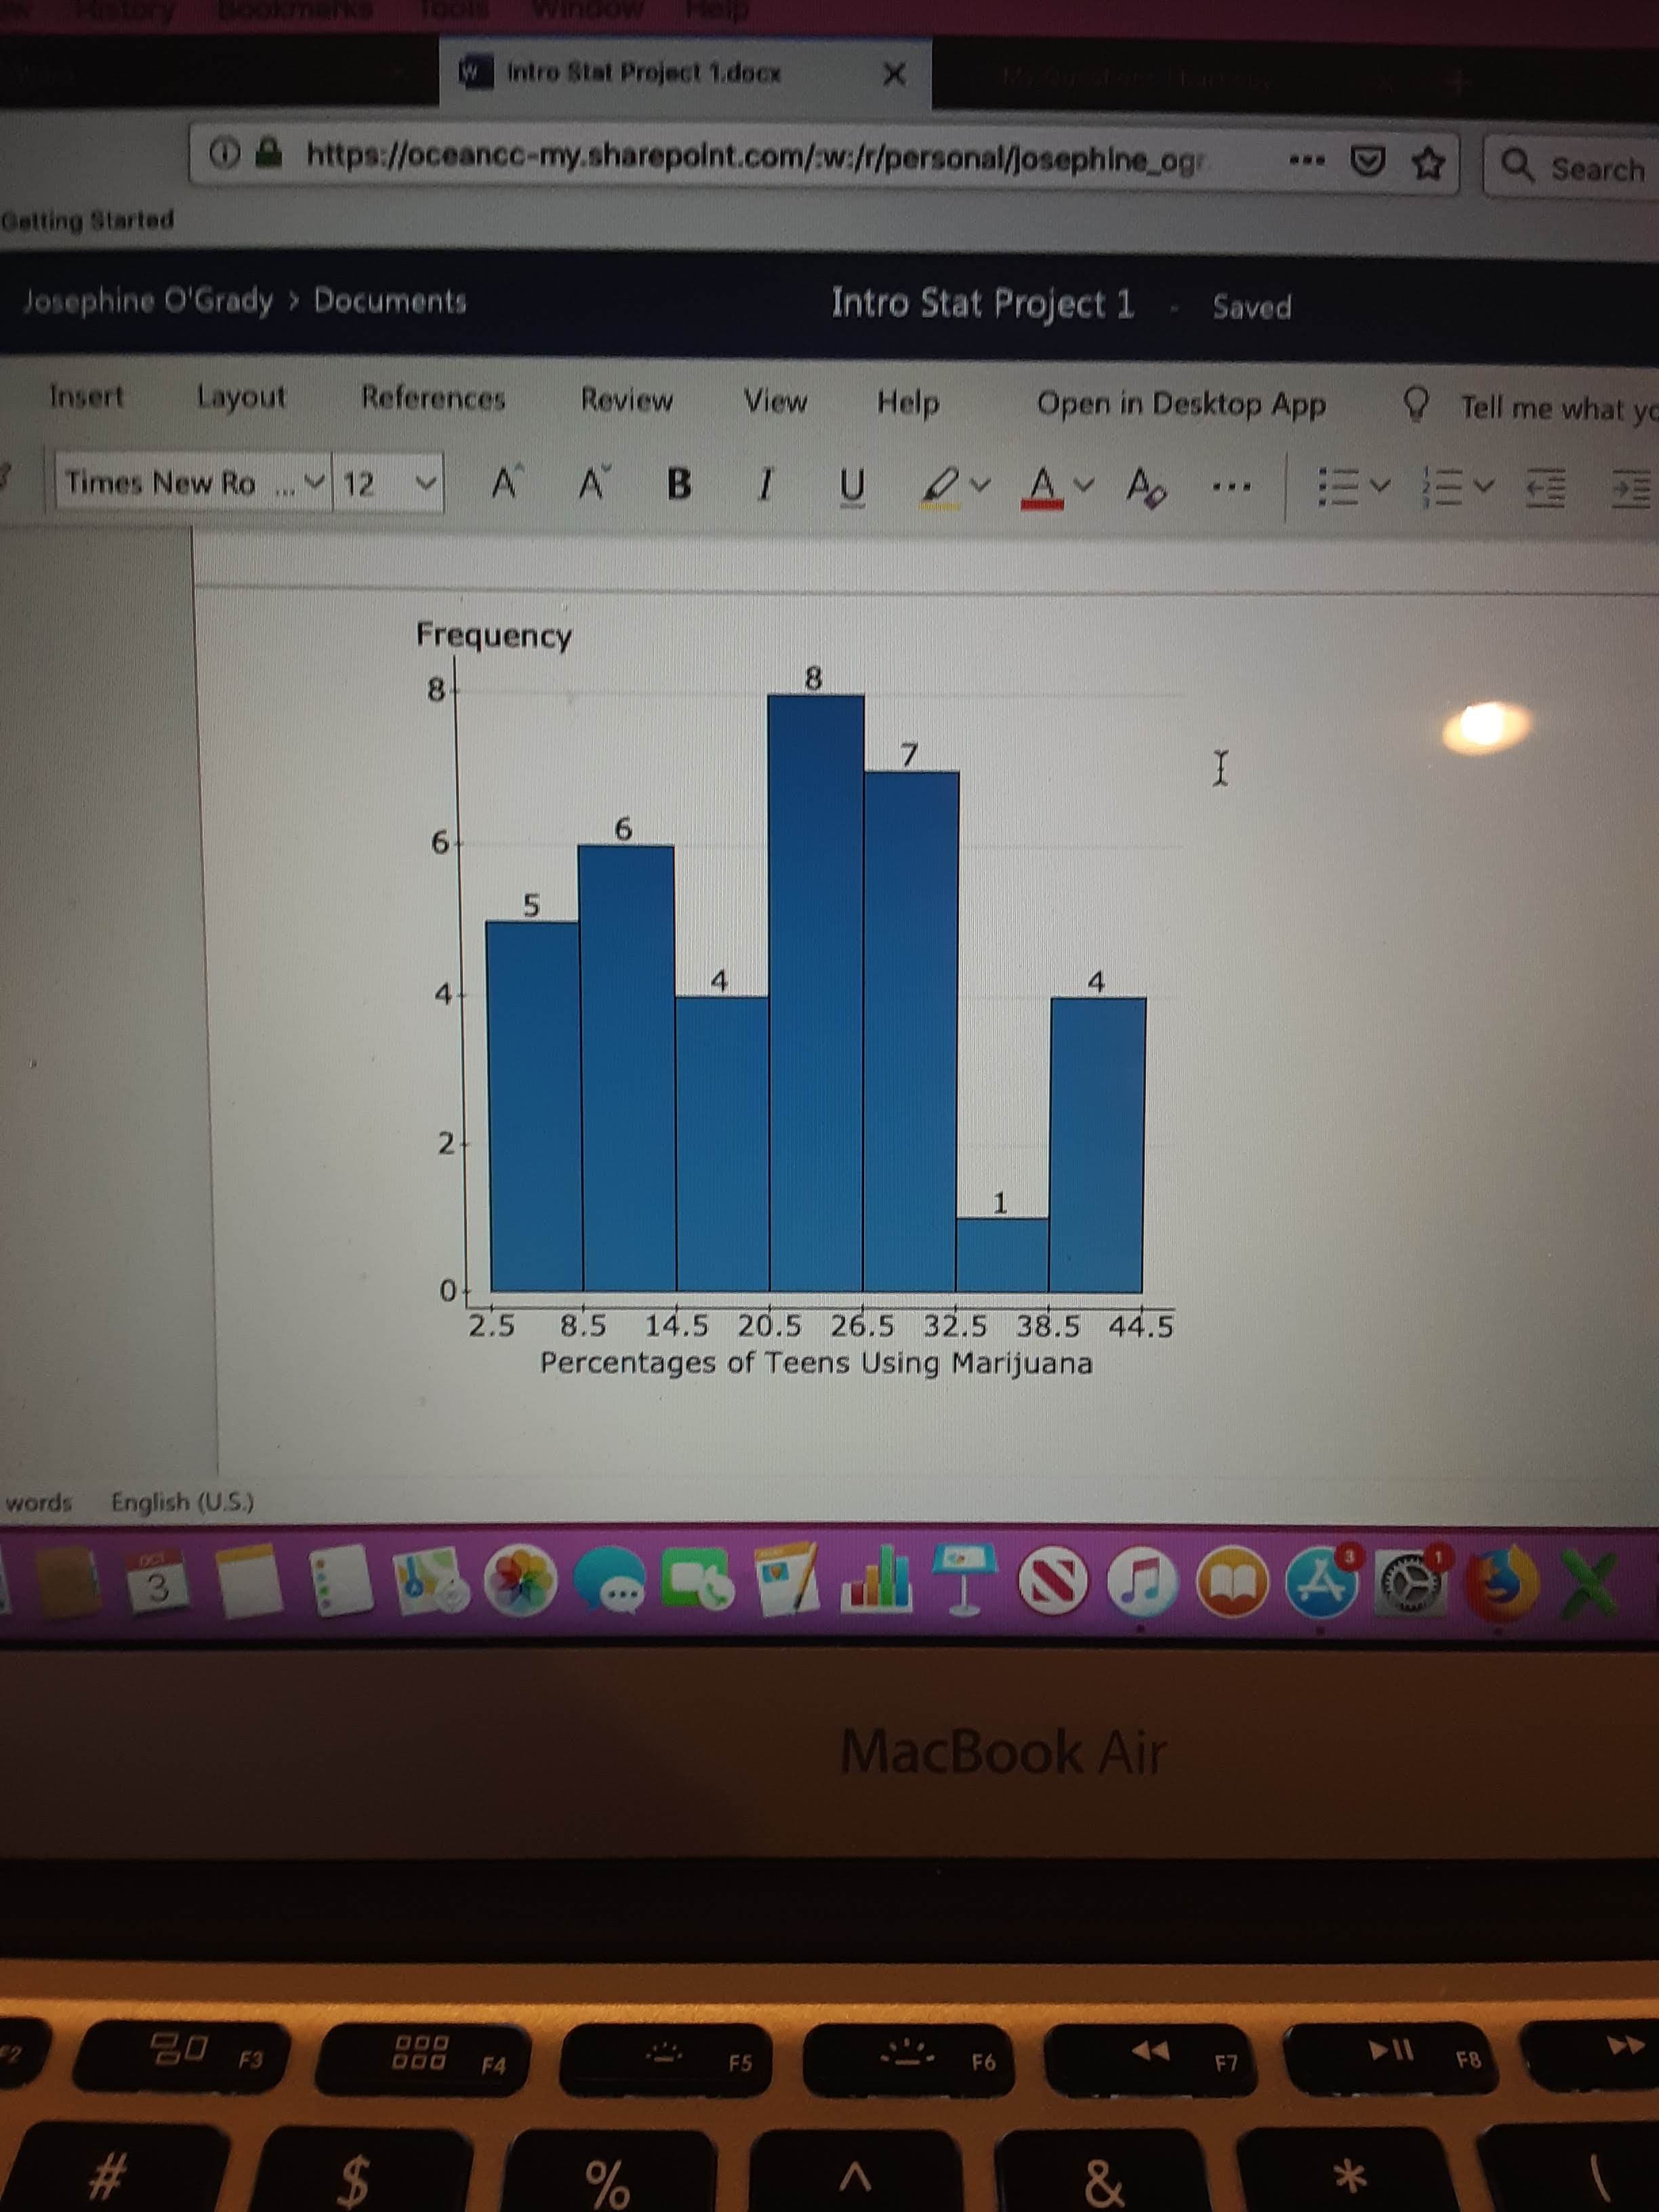
Is the shape of this distribution symmetrical?
How would you describe the shape, center, and spread?


Trending now
This is a popular solution!

Step by step
Solved in 2 steps


