Month Period Units an 1 39813 Feb Mar 2 40080 3 47443 Apr May 4 47293 49211 un 51475 ul 7 46468 Aug бер Oct Nov 8 45210 9 44799 10 46989 11 42164 Dec 12 44187 an 13 42231 Feb 14 45425 Mar 15 54075 Apr May 16 50927 17 53571 un 18 54922 ul 19 54446 Aug Sep Oct 20 56081 21 52179 22 50082 Nov 23 48515 Dec 24 49280
Month Period Units an 1 39813 Feb Mar 2 40080 3 47443 Apr May 4 47293 49211 un 51475 ul 7 46468 Aug бер Oct Nov 8 45210 9 44799 10 46989 11 42164 Dec 12 44187 an 13 42231 Feb 14 45425 Mar 15 54075 Apr May 16 50927 17 53571 un 18 54922 ul 19 54446 Aug Sep Oct 20 56081 21 52179 22 50082 Nov 23 48515 Dec 24 49280

Practical Management Science
6th Edition
ISBN:9781337406659
Author:WINSTON, Wayne L.
Publisher:WINSTON, Wayne L.
Chapter13: Regression And Forecasting Models
Section13.7: Exponential Smoothing Models
Problem 26P: The file P13_26.xlsx contains the monthly number of airline tickets sold by the CareFree Travel...

Related questions
Question
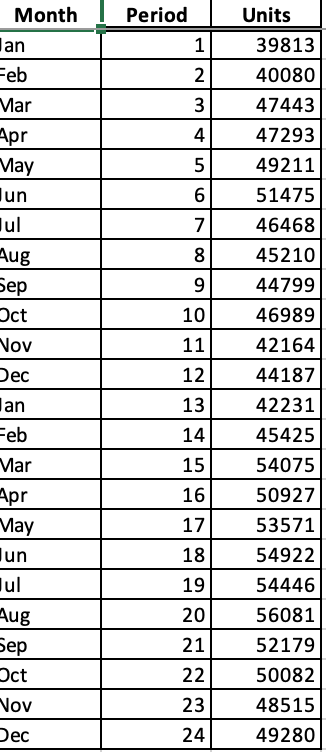
Transcribed Image Text:Month
Period
Units
lan
Feb
39813
2
40080
Mar
3
47443
Apr
May
lun
lul
Aug
Бер
Oct
4
47293
49211
51475
7
46468
8
45210
9
44799
10
46989
Nov
11
42164
Dec
12
44187
lan
13
42231
Feb
14
45425
Mar
15
54075
Apr
16
50927
May
lun
lul
17
53571
18
54922
19
54446
Aug
Бер
Oct
20
56081
21
52179
22
50082
Nov
23
48515
Dec
24
49280
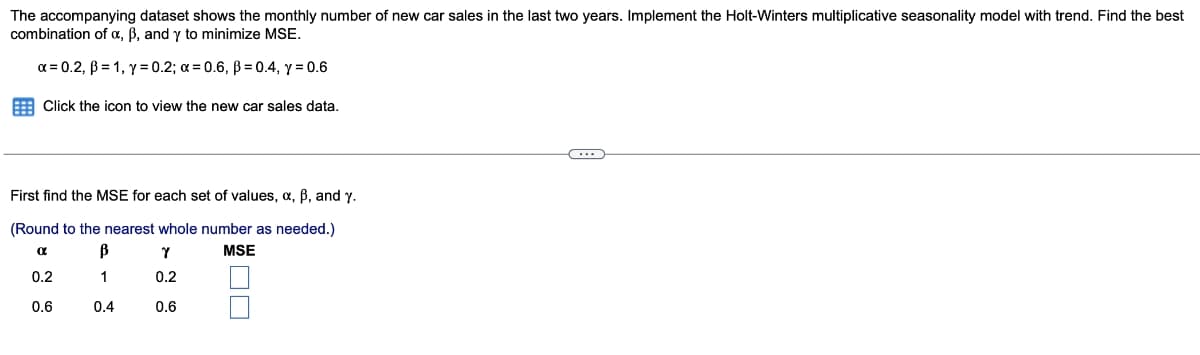
Transcribed Image Text:The accompanying dataset shows the monthly number of new car sales in the last two years. Implement the Holt-Winters multiplicative seasonality model with trend. Find the best
combination of a, ß, and y to minimize MSE.
a = 0.2, B = 1, y =0.2; a = 0.6, ß = 0.4, y = 0.6
E Click the icon to view the new car sales data.
First find the MSE for each set of values, a, B, and y.
(Round to the nearest whole number as needed.)
MSE
0.2
1
0.2
0.6
0.4
0.6
Expert Solution
This question has been solved!
Explore an expertly crafted, step-by-step solution for a thorough understanding of key concepts.

Step by step
Solved in 4 steps with 4 images

Recommended textbooks for you
Practical Management Science
Operations Management
ISBN:
9781337406659
Author:
WINSTON, Wayne L.
Publisher:
Cengage,

Contemporary Marketing
Marketing
ISBN:
9780357033777
Author:
Louis E. Boone, David L. Kurtz
Publisher:
Cengage Learning

Marketing
Marketing
ISBN:
9780357033791
Author:
Pride, William M
Publisher:
South Western Educational Publishing
Practical Management Science
Operations Management
ISBN:
9781337406659
Author:
WINSTON, Wayne L.
Publisher:
Cengage,
Contemporary Marketing
Marketing
ISBN:
9780357033777
Author:
Louis E. Boone, David L. Kurtz
Publisher:
Cengage Learning
Marketing
Marketing
ISBN:
9780357033791
Author:
Pride, William M
Publisher:
South Western Educational Publishing