More realistically, suppose you can collect observational data on several thousand fourth graders in a given state. You can obtain the size of their fourth-grade class and a standardized test score taken at the end of fourth grade. Why might you expect a negative correlation between class size and test score?
More realistically, suppose you can collect observational data on several thousand fourth graders in a given state. You can obtain the size of their fourth-grade class and a standardized test score taken at the end of fourth grade. Why might you expect a negative correlation between class size and test score?

Functions and Change: A Modeling Approach to College Algebra (MindTap Course List)
6th Edition
ISBN:9781337111348
Author:Bruce Crauder, Benny Evans, Alan Noell
Publisher:Bruce Crauder, Benny Evans, Alan Noell
Chapter5: A Survey Of Other Common Functions
Section5.3: Modeling Data With Power Functions
Problem 6E: Urban Travel Times Population of cities and driving times are related, as shown in the accompanying...

Related questions
Question
Part b please
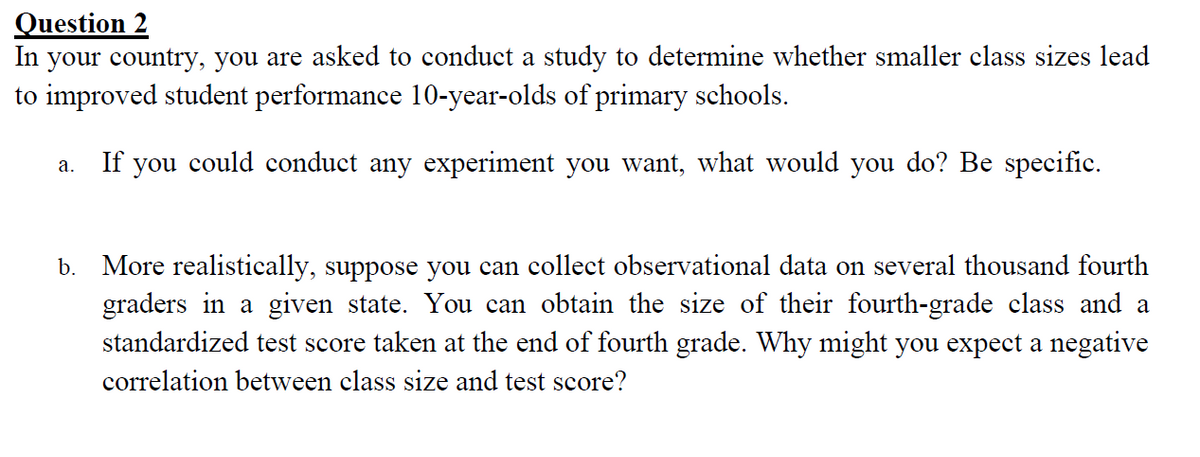
Transcribed Image Text:Question 2
In your country, you are asked to conduct a study to determine whether smaller class sizes lead
to improved student performance 10-year-olds of primary schools.
If you could conduct any experiment you want, what would you do? Be specific.
а.
b. More realistically, suppose you can collect observational data on several thousand fourth
graders in a given state. You can obtain the size of their fourth-grade class and a
standardized test score taken at the end of fourth grade. Why might you expect a negative
correlation between class size and test score?
Expert Solution
This question has been solved!
Explore an expertly crafted, step-by-step solution for a thorough understanding of key concepts.

This is a popular solution!

Trending now
This is a popular solution!

Step by step
Solved in 3 steps

Recommended textbooks for you
Functions and Change: A Modeling Approach to Coll…
Algebra
ISBN:
9781337111348
Author:
Bruce Crauder, Benny Evans, Alan Noell
Publisher:
Cengage Learning
Functions and Change: A Modeling Approach to Coll…
Algebra
ISBN:
9781337111348
Author:
Bruce Crauder, Benny Evans, Alan Noell
Publisher:
Cengage Learning