Most Americans (58% kindergarten through surveyed about whet the binomial distribu standard deviation to 76. Find the probabili 77. Find the probabili K-12. 78. Find the probabili 79. Find the probabili K-12. 80. Find the probabili
Most Americans (58% kindergarten through surveyed about whet the binomial distribu standard deviation to 76. Find the probabili 77. Find the probabili K-12. 78. Find the probabili 79. Find the probabili K-12. 80. Find the probabili

Glencoe Algebra 1, Student Edition, 9780079039897, 0079039898, 2018
18th Edition
ISBN:9780079039897
Author:Carter
Publisher:Carter
Chapter10: Statistics
Section10.4: Distributions Of Data
Problem 19PFA

Related questions
Question
76,77,78,79,80
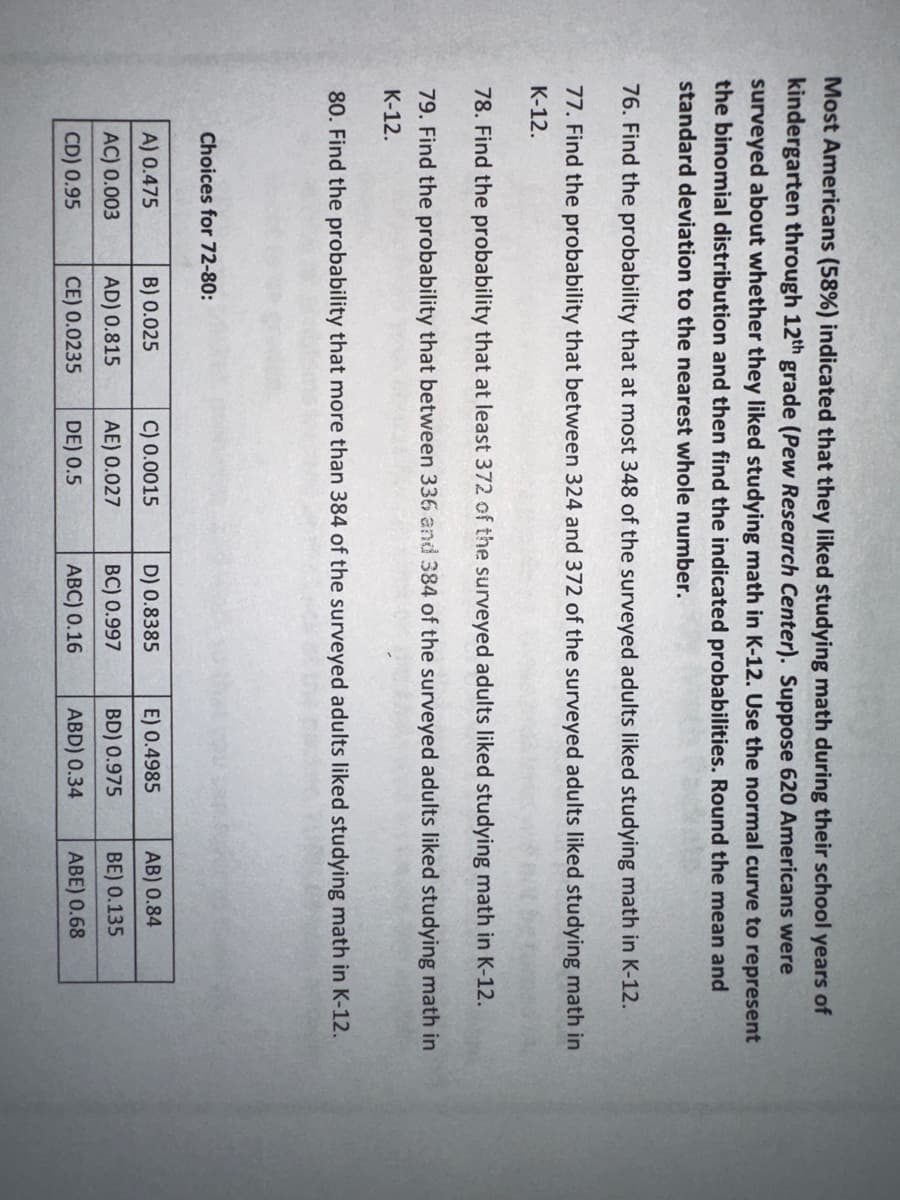
Transcribed Image Text:Most Americans (58%) indicated that they liked studying math during their school years of
kindergarten through 12th grade (Pew Research Center). Suppose 620 Americans were
surveyed about whether they liked studying math in K-12. Use the normal curve to represent
the binomial distribution and then find the indicated probabilities. Round the mean and
standard deviation to the nearest whole number.
76. Find the probability that at most 348 of the surveyed adults liked studying math in K-12.
77. Find the probability that between 324 and 372 of the surveyed adults liked studying math in
K-12.
78. Find the probability that at least 372 of the surveyed adults liked studying math in K-12.
79. Find the probability that between 336 and 384 of the surveyed adults liked studying math in
K-12.
80. Find the probability that more than 384 of the surveyed adults liked studying math in K-12.
Choices for 72-80:
A) 0.475
AC) 0.003
CD) 0.95
B) 0.025
AD) 0.815
CE) 0.0235
C) 0.0015
AE) 0.027
DE) 0.5
D) 0.8385
BC) 0.997
ABC) 0.16
E) 0.4985
BD) 0.975
ABD) 0.34
AB) 0.84
BE) 0.135
ABE) 0.68
Expert Solution
This question has been solved!
Explore an expertly crafted, step-by-step solution for a thorough understanding of key concepts.

Step by step
Solved in 4 steps with 5 images

Recommended textbooks for you
Glencoe Algebra 1, Student Edition, 9780079039897…
Algebra
ISBN:
9780079039897
Author:
Carter
Publisher:
McGraw Hill
Glencoe Algebra 1, Student Edition, 9780079039897…
Algebra
ISBN:
9780079039897
Author:
Carter
Publisher:
McGraw Hill