mparative financial statements. The analysis should be benchmarked with competitors. or stability, and pre pare a report indicating your comments on the financial health and performance of Denchmarked with competitors) using the following liquidity ratios: (1) current ratio, nover, (3) inventory turnover, and (4) quick ratio. Give your insights into the relative solvency or stability of the company (as benchmark mpetitors) using the following ratios: (1) debt ratio, (2) times interest earned ratio, and (3 tio. Also, assess the relative profitability of the company (as benchmarked with competito ets and (4) r
mparative financial statements. The analysis should be benchmarked with competitors. or stability, and pre pare a report indicating your comments on the financial health and performance of Denchmarked with competitors) using the following liquidity ratios: (1) current ratio, nover, (3) inventory turnover, and (4) quick ratio. Give your insights into the relative solvency or stability of the company (as benchmark mpetitors) using the following ratios: (1) debt ratio, (2) times interest earned ratio, and (3 tio. Also, assess the relative profitability of the company (as benchmarked with competito ets and (4) r

Chapter3: Evaluation Of Financial Performance
Section: Chapter Questions
Problem 5P

Related questions
Question
100%
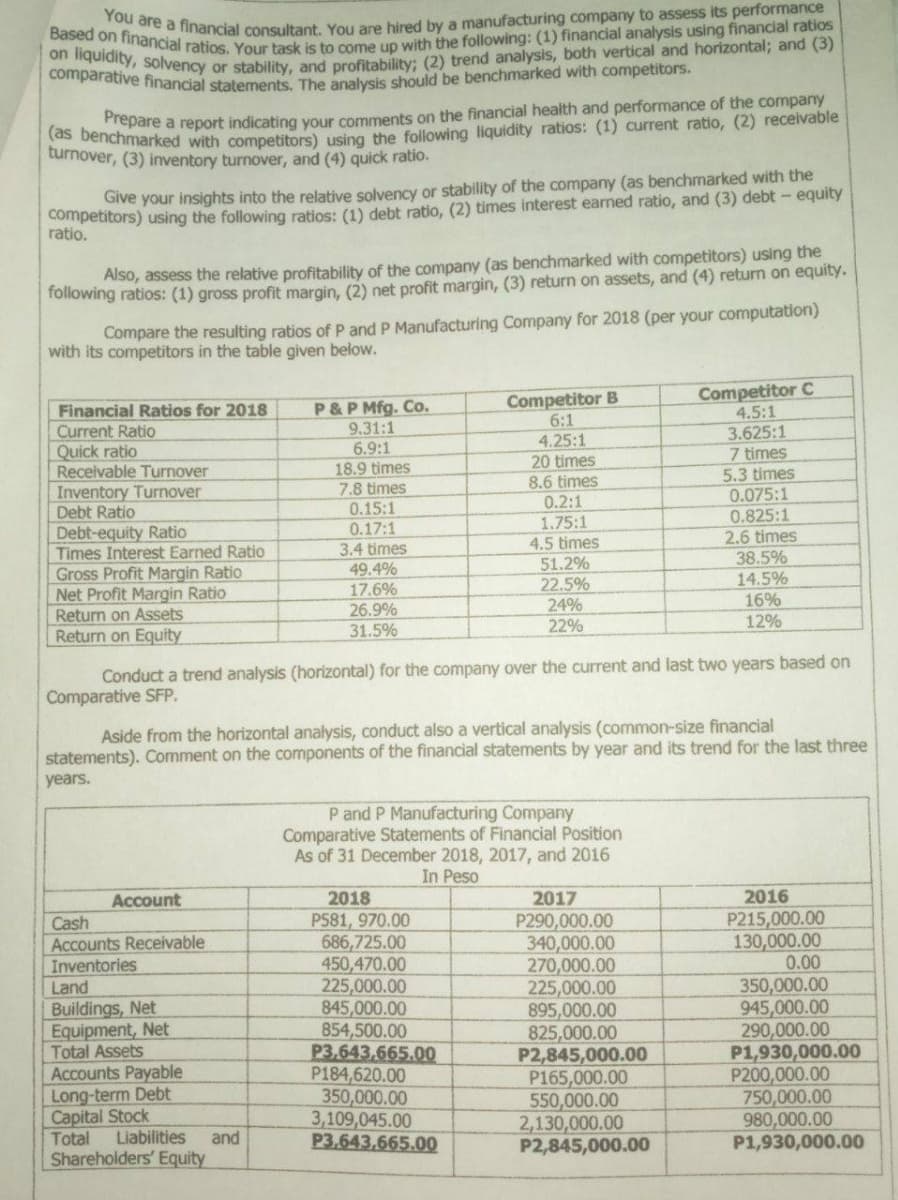
Transcribed Image Text:You are a financial consultant. You are hired by a manufacturing company to assess its performance
Based on financial ratios. Your task is to come up with the following: (1) financial analysis using financial ratios
on liquidity, solvency or stability, and profitability; (2) trend analysis, both vertical and horizontal; and (3)
comparative financial statements. The analysis should be benchmarked with competitors.
Frepare a report indicating your comments on the financial health and performance of the company
turenchmarked with competitors) using the following liquidity ratios: (1) current ratio, (2) receivable
turnover, (3) inventory turnover, and (4) quick ratio.
competitors) using the following ratios: (1) debt ratio, (2) times interest earned ratio, and (3) debt- equity
ratio.
Give your insights into the relative solvency or stability of the company (as benchmarked with the
Also, assess the relative profitability of the company (as benchmarked with competitors) using the
following ratios: (1) gross profit margin, (2) net profit margin, (3) return on assets, and (4) return on equity.
Compare the resulting ratios of P and P Manufacturing Company for 2018 (per your computation)
with its competitors in the table given below.
Competitor C
4.5:1
3.625:1
7 times
5.3 times
0.075:1
0.825:1
2.6 times
38.5%
14.5%
16%
12%
P&P Mfg. Co.
9.31:1
6.9:1
Competitor B
6:1
4.25:1
20 times
Financial Ratios for 2018
Current Ratio
Quick ratio
Receivable Turnover
Inventory Turnover
Debt Ratio
18.9 times
7.8 times
0.15:1
0.17:1
8.6 times
Debt-equity Ratio
Times Interest Earned Ratio
Gross Profit Margin Ratio
Net Profit Margin Ratio
Return on Assets
Return on Equity
0.2:1
1,75:1
4.5 times
51.2%
22.5%
24%
22%
3.4 times
49.4%
17.6%
26.9%
31.5%
Conduct a trend analysis (horizontal) for the company over the current and last two years based on
Comparative SFP.
Aside from the horizontal analysis, conduct also a vertical analysis (common-size financial
statements). Comment on the components of the financial statements by year and its trend for the last three
years.
P and P Manufacturing Company
Comparative Statements of Financial Position
As of 31 December 2018, 2017, and 2016
In Peso
Account
2018
2017
2016
P215,000.00
130,000.00
0.00
P581, 970.00
686,725.00
450,470.00
225,000.00
845,000.00
854,500.00
P3,643,665.00
P184,620.00
350,000.00
3,109,045.00
P3,643,665.00
P290,000.00
340,000.00
270,000.00
225,000.00
895,000.00
825,000.00
P2,845,000.00
P165,000.00
550,000.00
2,130,000.00
P2,845,000.00
Cash
Accounts Receivable
Inventories
350,000.00
945,000.00
290,000.00
P1,930,000.00
P200,000.00
750,000.00
980,000.00
P1,930,000.00
Land
Buildings, Net
Equipment, Net
Total Assets
Accounts Payable
Long-term Debt
Capital Stock
Liabilities
and
Total
Shareholders' Equity
Expert Solution
This question has been solved!
Explore an expertly crafted, step-by-step solution for a thorough understanding of key concepts.

Step by step
Solved in 6 steps

Knowledge Booster


Learn more about
Need a deep-dive on the concept behind this application? Look no further. Learn more about this topic, accounting and related others by exploring similar questions and additional content below.Recommended textbooks for you
EBK CONTEMPORARY FINANCIAL MANAGEMENT
Finance
ISBN:
9781337514835
Author:
MOYER
Publisher:
CENGAGE LEARNING - CONSIGNMENT

Cornerstones of Financial Accounting
Accounting
ISBN:
9781337690881
Author:
Jay Rich, Jeff Jones
Publisher:
Cengage Learning

EBK CONTEMPORARY FINANCIAL MANAGEMENT
Finance
ISBN:
9781337514835
Author:
MOYER
Publisher:
CENGAGE LEARNING - CONSIGNMENT
Cornerstones of Financial Accounting
Accounting
ISBN:
9781337690881
Author:
Jay Rich, Jeff Jones
Publisher:
Cengage Learning

Intermediate Financial Management (MindTap Course…
Finance
ISBN:
9781337395083
Author:
Eugene F. Brigham, Phillip R. Daves
Publisher:
Cengage Learning