Mr Addison demonstrates electromagnetic induction by dropping a bar magnet through a flat coil of wire connected to a data logger. S N Data logger A graph of induced emf across the coin against time is produced from the data logger. Explain the shape of the graph below and the relevant values on both axes. Induced e.m.f. Time
Mr Addison demonstrates electromagnetic induction by dropping a bar magnet through a flat coil of wire connected to a data logger. S N Data logger A graph of induced emf across the coin against time is produced from the data logger. Explain the shape of the graph below and the relevant values on both axes. Induced e.m.f. Time

Power System Analysis and Design (MindTap Course List)
6th Edition
ISBN:9781305632134
Author:J. Duncan Glover, Thomas Overbye, Mulukutla S. Sarma
Publisher:J. Duncan Glover, Thomas Overbye, Mulukutla S. Sarma
Chapter6: Power Flows
Section: Chapter Questions
Problem 6.23P

Related questions

Question
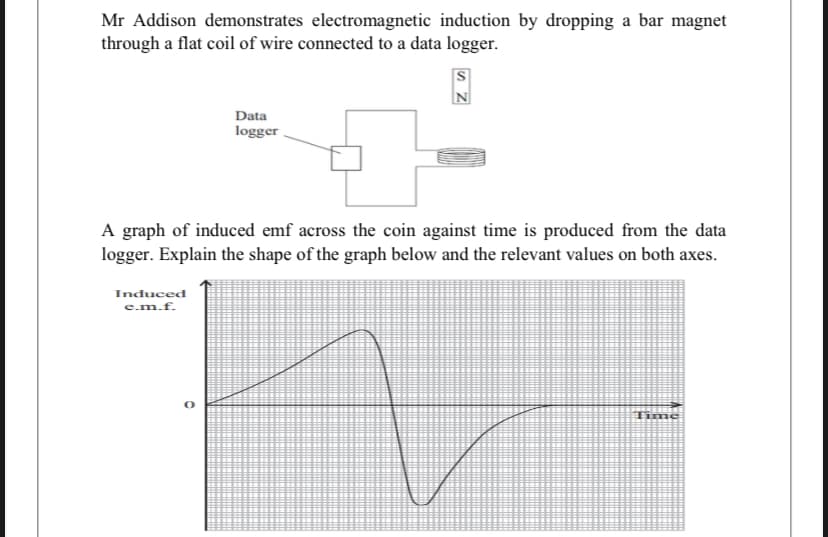
Transcribed Image Text:Mr Addison demonstrates electromagnetic induction by dropping a bar magnet
through a flat coil of wire connected to a data logger.
Data
logger
A graph of induced emf across the coin against time is produced from the data
logger. Explain the shape of the graph below and the relevant values on both axes.
Induced
e.m.f.
Time
Expert Solution
This question has been solved!
Explore an expertly crafted, step-by-step solution for a thorough understanding of key concepts.

Step by step
Solved in 2 steps

Knowledge Booster


Learn more about
Need a deep-dive on the concept behind this application? Look no further. Learn more about this topic, electrical-engineering and related others by exploring similar questions and additional content below.Recommended textbooks for you
Power System Analysis and Design (MindTap Course …
Electrical Engineering
ISBN:
9781305632134
Author:
J. Duncan Glover, Thomas Overbye, Mulukutla S. Sarma
Publisher:
Cengage Learning
Power System Analysis and Design (MindTap Course …
Electrical Engineering
ISBN:
9781305632134
Author:
J. Duncan Glover, Thomas Overbye, Mulukutla S. Sarma
Publisher:
Cengage Learning