MRO Department - 2020 Results 3 Revenues (billed out): 4 - Labor (hrs.) 5 - Labor rate ($/hr.) 6 - Parts (S/hr.) 7 Costs: 3 - Labor (hrs.) 9 - Labor ($/hr.) 10 - Parts (% of revenue) Budget 3,456 Actual Fav./(Unfav.) 3,648 Change in Gross Margin 45,868 192 120 120 Labor Variance Revenue (hrs.) Parts Variance Revenue (hrs.) Revenue ($/hr.) Costs (hrs.) Costs ($/hr.) 345 320 (25) 3,840 3,877 Rate (S/hr.) Costs (hrs.) 37 42 44 2 80% 77% -3% Labor ($/hr.) 11 12 Revenues: 13 - Labor 14 - Parts Total Mark-up S Fav./(Unfav.) Other 437,760 414,720 1,192,320 1,168,092 23,040 Total (24,228) 15 16 Costs: 17 - Labor 18 - Parts 19 20 e1 Gross Margin 22 Overhead: 23 - Space 24 - General & Admin. 25 - Depreciation 26 - Legal & Regulatory 27 28 29 Net before Taxes 30 Taxes 31 Net after Taxes Total Revenues 1,607,040 1,605,852 (1,188) 161,280 953,856 168,650 899,431 7,370 (54,425) (47,056) Total Costs 1,115,136 1,068,080 Insert your text explanation of the variances here. 491,904 537,772 45,868 75,000 35,000 68,500 75,000 35,000 68,500 18,000 18,000 196,500 Total Overhead 196,500 295,404 62,035 341,272 71,667 45,868 9,632 233,369 269,605 36,235
MRO Department - 2020 Results 3 Revenues (billed out): 4 - Labor (hrs.) 5 - Labor rate ($/hr.) 6 - Parts (S/hr.) 7 Costs: 3 - Labor (hrs.) 9 - Labor ($/hr.) 10 - Parts (% of revenue) Budget 3,456 Actual Fav./(Unfav.) 3,648 Change in Gross Margin 45,868 192 120 120 Labor Variance Revenue (hrs.) Parts Variance Revenue (hrs.) Revenue ($/hr.) Costs (hrs.) Costs ($/hr.) 345 320 (25) 3,840 3,877 Rate (S/hr.) Costs (hrs.) 37 42 44 2 80% 77% -3% Labor ($/hr.) 11 12 Revenues: 13 - Labor 14 - Parts Total Mark-up S Fav./(Unfav.) Other 437,760 414,720 1,192,320 1,168,092 23,040 Total (24,228) 15 16 Costs: 17 - Labor 18 - Parts 19 20 e1 Gross Margin 22 Overhead: 23 - Space 24 - General & Admin. 25 - Depreciation 26 - Legal & Regulatory 27 28 29 Net before Taxes 30 Taxes 31 Net after Taxes Total Revenues 1,607,040 1,605,852 (1,188) 161,280 953,856 168,650 899,431 7,370 (54,425) (47,056) Total Costs 1,115,136 1,068,080 Insert your text explanation of the variances here. 491,904 537,772 45,868 75,000 35,000 68,500 75,000 35,000 68,500 18,000 18,000 196,500 Total Overhead 196,500 295,404 62,035 341,272 71,667 45,868 9,632 233,369 269,605 36,235

Cornerstones of Financial Accounting
4th Edition
ISBN:9781337690881
Author:Jay Rich, Jeff Jones
Publisher:Jay Rich, Jeff Jones
Chapter5: Sales And Receivables
Section: Chapter Questions
Problem 77E: Ratio Analysis The following information was taken from Logsden Manufacturings trial balances as of...

Related questions
Question
Please include formulas
Transcribed Image Text:G
D E
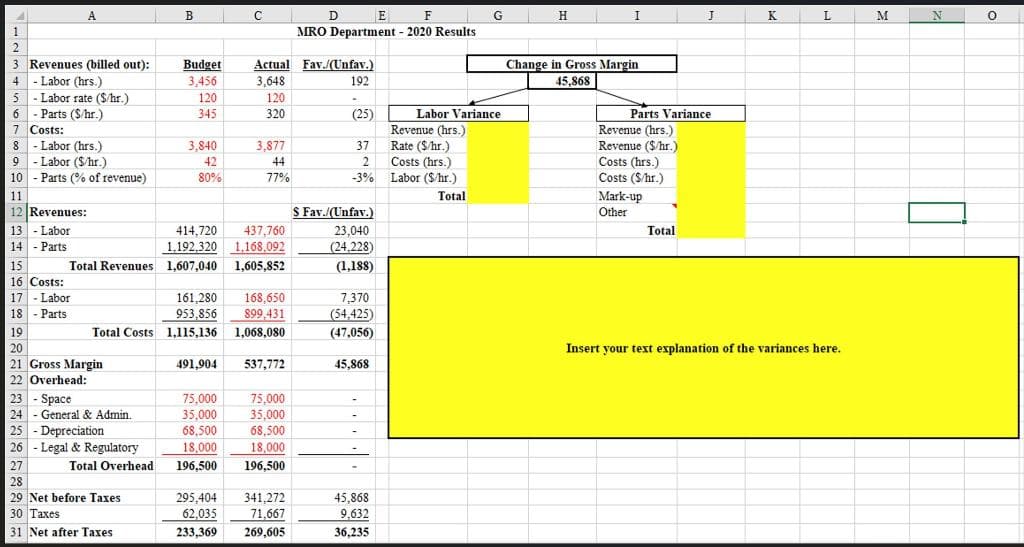
MRO Department 2020 Results
A
B
F
H.
I
J
K
M
3 Revenues (billed out):
Change in Gross Margin
Budget
3,456
Actual Fav./(Unfav.)
3,648
4 - Labor (hrs.)
5 - Labor rate ($/hr.)
6 - Parts (S/hr.)
7 Costs:
8 - Labor (hrs.)
9 - Labor ($/hr.)
10 - Parts (% of revenue)
192
45,868
120
120
345
320
(25)
Labor Variance
Parts Variance
Revenue (hrs.)
Rate ($/hr.)
Costs (hrs.)
-3% Labor (S/hr.)
Revenue (hrs.)
Revenue ($/hr.)
Costs (hrs.)
3,840
3,877
37
42
44
2
80%
77%
Costs ($/hr.)
11
Total
Mark-up
S Fav./(Unfav.)
12 Revenues:
13 - Labor
Other
437,760
1,192,320 1,168,092
23,040
(24,228)
(1,188)
414,720
Total
14 - Parts
15
Total Revenues 1,607,040 1,605,852
16 Costs:
17 - Labor
- Parts
7,370
(54,425)
161,280
168,650
18
953,856
899,431
19
Total Costs 1,115,136 1,068,080
(47,056)
20
Insert your text explanation of the variances here.
21 Gross Margin
22 Overhead:
491,904
537,772
45,868
23 - Space
75,000
35,000
68,500
75,000
35,000
68,500
18,000
196,500
24 - General & Admin.
25 - Depreciation
26 - Legal & Regulatory
18,000
27
Total Overhead
196,500
28
29 Net before Taxes
30 Taxes
295,404
62,035
341,272
45,868
71,667
9,632
31 Net after Taxes
233,369
269,605
36,235
Expert Solution
This question has been solved!
Explore an expertly crafted, step-by-step solution for a thorough understanding of key concepts.

This is a popular solution!

Trending now
This is a popular solution!

Step by step
Solved in 2 steps with 2 images

Knowledge Booster


Learn more about
Need a deep-dive on the concept behind this application? Look no further. Learn more about this topic, accounting and related others by exploring similar questions and additional content below.Recommended textbooks for you
Cornerstones of Financial Accounting
Accounting
ISBN:
9781337690881
Author:
Jay Rich, Jeff Jones
Publisher:
Cengage Learning

Intermediate Accounting: Reporting And Analysis
Accounting
ISBN:
9781337788281
Author:
James M. Wahlen, Jefferson P. Jones, Donald Pagach
Publisher:
Cengage Learning

Cornerstones of Financial Accounting
Accounting
ISBN:
9781337690881
Author:
Jay Rich, Jeff Jones
Publisher:
Cengage Learning
Intermediate Accounting: Reporting And Analysis
Accounting
ISBN:
9781337788281
Author:
James M. Wahlen, Jefferson P. Jones, Donald Pagach
Publisher:
Cengage Learning