Mrs. Santos administered a Science Achievement Test to a random 45 graduating SHS students. In this example, the mean and standard deviation are 95 and 11. The population parameters are µ = 89 and o = 8. What example of the sampling distribution of the sample mean for the normal population portrays the situation I. a. Variance known b. Variance is unknown c. Standard deviation is small d. Standard deviation is large
Mrs. Santos administered a Science Achievement Test to a random 45 graduating SHS students. In this example, the mean and standard deviation are 95 and 11. The population parameters are µ = 89 and o = 8. What example of the sampling distribution of the sample mean for the normal population portrays the situation I. a. Variance known b. Variance is unknown c. Standard deviation is small d. Standard deviation is large

Glencoe Algebra 1, Student Edition, 9780079039897, 0079039898, 2018
18th Edition
ISBN:9780079039897
Author:Carter
Publisher:Carter
Chapter10: Statistics
Section10.4: Distributions Of Data
Problem 19PFA

Related questions
Topic Video
Question
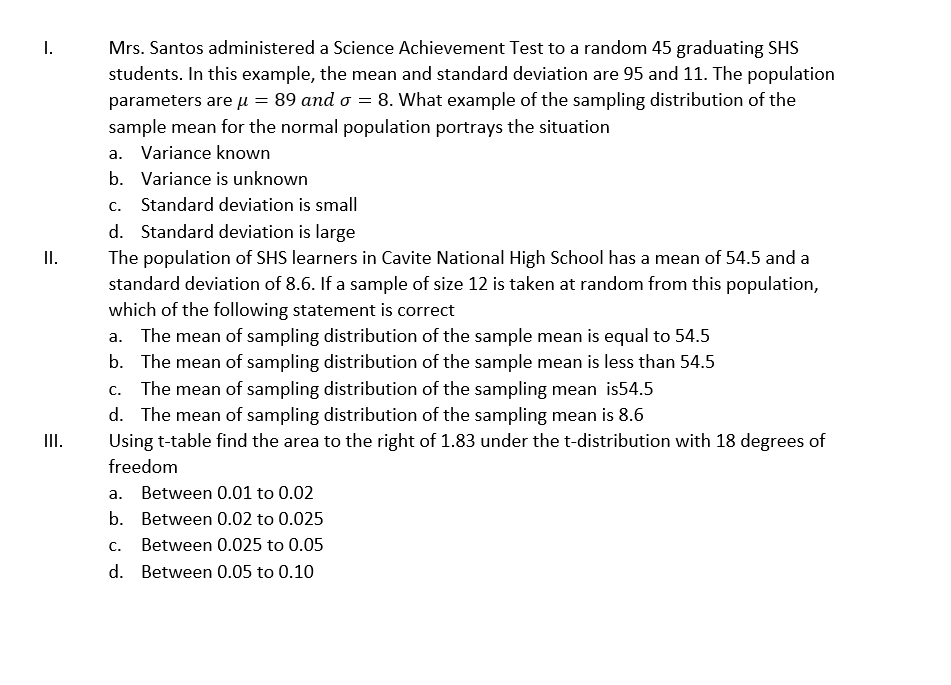
Transcribed Image Text:I.
Mrs. Santos administered a Science Achievement Test to a random 45 graduating SHS
students. In this example, the mean and standard deviation are 95 and 11. The population
parameters are u = 89 and o = 8. What example of the sampling distribution of the
sample mean for the normal population portrays the situation
a. Variance known
b. Variance is unknown
С.
Standard deviation is small
d. Standard deviation is large
II.
The population of SHS learners in Cavite National High School has a mean of 54.5 and a
standard deviation of 8.6. If a sample of size 12 is taken at random from this population,
which of the following statement is correct
a. The mean of sampling distribution of the sample mean is equal to 54.5
b. The mean of sampling distribution of the sample mean is less than 54.5
c. The mean of sampling distribution of the sampling mean is54.5
d. The mean of sampling distribution of the sampling mean is 8.6
Using t-table find the area to the right of 1.83 under the t-distribution with 18 degrees of
II.
freedom
a. Between 0.01 to 0.02
b. Between 0.02 to 0.025
C.
Between 0.025 to 0.05
d. Between 0.05 to 0.10
Expert Solution
This question has been solved!
Explore an expertly crafted, step-by-step solution for a thorough understanding of key concepts.

This is a popular solution!

Trending now
This is a popular solution!

Step by step
Solved in 2 steps

Knowledge Booster


Learn more about
Need a deep-dive on the concept behind this application? Look no further. Learn more about this topic, statistics and related others by exploring similar questions and additional content below.Recommended textbooks for you
Glencoe Algebra 1, Student Edition, 9780079039897…
Algebra
ISBN:
9780079039897
Author:
Carter
Publisher:
McGraw Hill
Glencoe Algebra 1, Student Edition, 9780079039897…
Algebra
ISBN:
9780079039897
Author:
Carter
Publisher:
McGraw Hill