N 1 1 1 0.000 0.000 0.000 6 16 0


Q: Let X denote the number of times a certain numerical control machine will malfunction: 1, 2, or 3…
A: Given f(x,y) y 1 2 3 Total x 1 0.10 0.05 0.02 0.17 2 0.10 0.35 0.05 0.50 3 0.03 0.10…
Q: response. Processed For Hi
A: In general, we reject the null hypothesis when test statistic will be greater than the critical…
Q: Every year, at the Academy awards ceremony, a Best Actress and Best Actor awards are given. Below…
A: The following information has been given: Best Actress Best Actor 28 62 63 52 29 41 41 39…
Q: 4) In testing the claim about the mean annual income of full-time college students is below $15,000,…
A: Given that Sample size n =40 Sample mean =14450 Sample standard deviation =2025
Q: It is possible for the probability of a Type I error (p-value) obtained from a t-test to be 0. Group…
A:
Q: a) A government hospital has the following data representing weight in kg at birth of 200 premature…
A: Comment:“Since you have asked multiple questions, we will solve the first question for you. If you…
Q: Construct a grouped frequency distribution for the data. Use the classes 19-28, 29-38, 39-48, 49-58,…
A: Answer:
Q: Provide the rank for each number in this data set: 5, 7, 7, 8, 7 5 7 8 Question Help Question 1:…
A: Given that ; data set: 5, 7, 7, 8, 7 5 7 8 Here we use the concept of rank. We use ascending order…
Q: (a) 400 labourers were selected at random from a certain district. Their mean income was 140-5…
A: Given 400 labourers were selected at random from a certain district, mean income =140.5$ standard…
Q: a. Use the one-mean t-interval procedure with the sample mean, sample size, sample standard…
A: The answer is attached below,
Q: A local restaurant employs Pete at the only operating counter. Pete takes on average 5 minutes to…
A: Given: Arrival rate λ = 2 customers per 15 minutes. λ = 8 customers per hour. Service time = 5…
Q: Coffee is a leading export from several developing countries. When coffee prices are high, farmers…
A: The given data is Price (cents per pound) 29 40 54 55 72 Forest lost (%) 0.49 1.59 1.69 1.82…
Q: In a certain state's Pick 3 lottery game, you pay $1.45 to select a sequence of three digits (from 0…
A:
Q: A diode detector is used to measure the radio frequency power, expressed dBm. The average power in a…
A: Given: Sample size n = 500 Sample mean X = 4.44 Sample variance s2 = 0.00219 Confidence level = 97%…
Q: The relative frequency histogram represents the length of phone calls on George's cell phone during…
A: The option is D.
Q: An airline company is interested in improving customer satisfaction rate from the 55% currently…
A: Given data p=55% n=280 x=168
Q: Suppose we are testing the Null Hypothesis H0: μ = 75 against the Alternative Hypothesis Ha: μ ≠…
A: GivenNull and alternative hypothesis isH0:μ=75Ha:μ≠75sample size(n)=36Mean(x)=72standard…
Q: The average income in Boston is 6200 witha standard deviation of 8000, while the average income in…
A: GivenFor BostonMean(μ)=6200standard deviation(σ)=8000For chicagoMean(μ)=48000standard…
Q: er true or false to each statement concerning a confidence interval for a population mean. Give…
A:
Q: How much caffeine is in a cup of coffee? Suppose the amount, a, of caffeine in a cup of coffee A is…
A: As per bartleby policy I answered the a to h subparts
Q: According to a study of political prisoners, the mean duration of imprisonment for 32 prisoners with…
A: Given that Mean duration of the 32 prisoners with chronic post traumatic stress (PTSD) was 30.6…
Q: nt in Charlotte, North use: advise and possib er, and arrest the offen. termined by re-arrest r
A: number of subsequent arrest arrest citation advise/separate total 0 175 181 187 543 1 36 33 24…
Q: To construct a confidence interval for the difference between two popul 0²77 0²2/2 1 + (x₁-x₂) -Zc +…
A: For the given data Find 95% Confidence interval for μ1-μ2
Q: You want to obtain a sample to estimate a population proportion. Based on previous evidence, you…
A: The population proportion is 76%; p=0.76 Margin of error is 2.5%; Margin of error=0.025…
Q: In a large city 1 person in 5 is left handed. Find the probability that in a random sample of 10…
A: From the provided information, In a large city 1 person in 5 is left-handed that is p = 1/5 = 0.2…
Q: 1. Let X denote the number of times a certain numerical control machine will malfunction: 1, 2, or 3…
A: For independent variable,f(x,y)=f(x).f(y).check for value (2,1) Above condition.
Q: 2009 66 16 74 61 2010 60 33 953 90 Given: sample mean = 225 Standard deviation = 442.9413 n = 20…
A: Given,sample mean(x¯)=225standard deviation(s)=442.9413degrees of…
Q: One of the undersecretaries of the Department of Labor and Employment (DOLE) claims that the average…
A: Given that One of the undersecretaries of the Department of Labor and Employment (DOLE) claims that…
Q: Lifetimes of Wristwatches A random sample of the lifetimes of 28 inexpensive wristwatches has a…
A: Given Sample size =28 Standard deviations=4.6
Q: Claim: μ₁ = ₂; x = 0.05. Assume o 0 ² = 0²/2 1 Sample statistics: x₁ = 33.3, s₁ = 3.5, n₁ = 13 and…
A: Givenclaim is μ1=μ2α=0.05Assume σ12=σ22Mean(x1)=33.3standard deviation(s1)=3.5sample…
Q: Suppose you are testing Hoμ = 94 against Ha: μ< 94. From an SRS of 68 individuals, you compute X =…
A:
Q: Determine the standardized test statistic. z = ____ Determine the P-value. P=____
A:
Q: What is the probability that the sample proportion is between 0.3 and 0.42?
A: HERE GIVEN , Based on historical data, your manager believes that 35% of the company's orders come…
Q: Find the lower and upper X ² critical values at 80% confidence and sample size 16. Round to the 3…
A: Given Confidence interval 80% n=16
Q: Suppose we are interested in the average reading achievement test score of all the currently…
A: An element is an entity based on which the data is collected, A sample is subpart of a larger…
Q: rtises that the median life of the machines is at least 8 years. A consumer advocacy group located…
A: a). The null and alternative hypothesis is given as, H0:Median≥8Ha:Median<8
Q: A) Following is a boxplot for the data above is it reasonable to assume that the condition for…
A: Given:- The time is taken by each rat to navigate the maze field and a box plot is given. To check:-…
Q: The probability density function of the net weight in pounds of a packaged chemical herbicide is…
A: Simple pdf method and mean method are used.
Q: Is the national crime rate really going down? Some sociologists say yes! They say that the reason…
A: According to the FBI and the Justice Department, 70% of all arrests are of males aged 15 to 34…
Q: A) determine the correlation coefficient, rounded to the nearest thousandth b) find the equation of…
A: here given data for time watching TV and time on internet here take x= time watching TV y = time…
Q: Out of 500 people sampled, 170 had kids. Based on this, construct a 99% confidence interval for the…
A:
Q: is long. Suppose an antiquities store in Athens has a very old manuscript that the owner claims is…
A: The hypothesized proportion value is 0.214.
Q: Single adults: According to a Pew Research Center analysis of census data, in 2012, 20% of American…
A: The provided information is The sample proportion is p=0.20 The sample size is n=25 the unusual to…
Q: In a study of statistics professors' salaries (USA) the following data was obtained: n=23,…
A: The answer is attached below,
Q: In the General Social Survey, respondents were asked "If your party nominated a woman for President,…
A:
Q: geles research group publishes an an- on trends in real estate. 200 randomly selected real estate…
A:
Q: A kurtosis value near zero indicates which of the following? O mesokurtic distribution O leptokurtic…
A: Answer:
Q: a. Arrange the data as a two-way table and report how many students are in each cell. For each cell,…
A: Male Female Total Brown III I Blue 0 II Hazel III II Total
Q: In a study of statistics professors' salaries (USA) the following data was obtained: n=16,…
A: Givensample size(n)=16Mean(x)=105000standard deviation(s)=13000Confidence interval = 95%
Q: Giving a test to a group of students, the grades and gender are summarized below A B C Total…
A: The sample size is n=102. The favorable cases (the number of non-binary students who receive a grade…

Step by step
Solved in 2 steps

- Table 6 shows the population, in thousands, of harbor seals in the Wadden Sea over the years 1997 to 2012. a. Let x represent time in years starting with x=0 for the year 1997. Let y represent the number of seals in thousands. Use logistic regression to fit a model to these data. b. Use the model to predict the seal population for the year 2020. c. To the nearest whole number, what is the limiting value of this model?Olympic Pole Vault The graph in Figure 7 indicates that in recent years the winning Olympic men’s pole vault height has fallen below the value predicted by the regression line in Example 2. This might have occurred because when the pole vault was a new event there was much room for improvement in vaulters’ performances, whereas now even the best training can produce only incremental advances. Let’s see whether concentrating on more recent results gives a better predictor of future records. (a) Use the data in Table 2 (page 176) to complete the table of winning pole vault heights shown in the margin. (Note that we are using x=0 to correspond to the year 1972, where this restricted data set begins.) (b) Find the regression line for the data in part ‚(a). (c) Plot the data and the regression line on the same axes. Does the regression line seem to provide a good model for the data? (d) What does the regression line predict as the winning pole vault height for the 2012 Olympics? Compare this predicted value to the actual 2012 winning height of 5.97 m, as described on page 177. Has this new regression line provided a better prediction than the line in Example 2?Sales of a video game released in the year 2000 took off at first, but then steadily slowed as time moved on. Table 4 shows the number of games sold, in thousands, from the years 20002010. a. Let x represent time in years starting with x=1 for the year 2000. Let y represent the number of games sold in thousands. Use logarithmic regression to fit a model to these data. b. If games continue to sell at this rate, how many games will sell in 2015? Round to the nearest thousand.
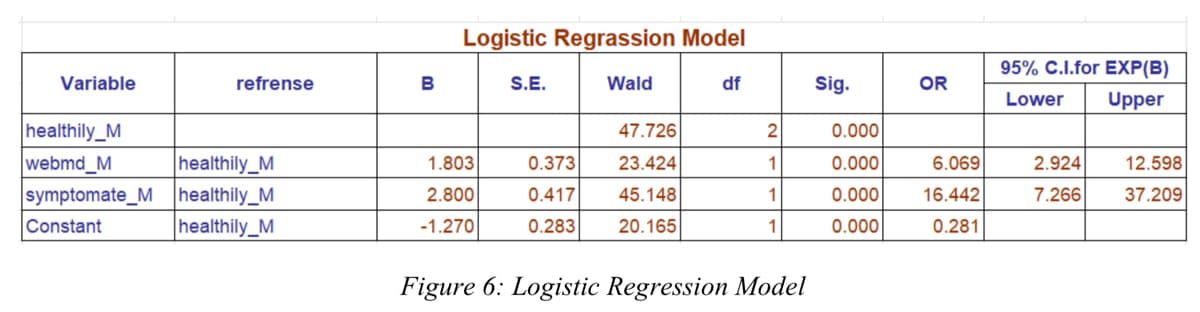
- Table 2 shows a recent graduate’s credit card balance each month after graduation. a. Use exponential regression to fit a model to these data. b. If spending continues at this rate, what will the graduate’s credit card debt be one year after graduating?A researcher is attempting to explore the relationship between study duration per day (0 - 8) and the passing of the science course (Pass=1, Fail=0). For this purpose, a sample of 36 students from Alabama University are chosen. Summary of the logistic regression model has been included. Please help me understand and choose from the following below, which is the correct representation of the related logistic regression model in the summary photo attached. - PASS = 0.57 + 3.69 X SDURATION - PASS= 3.69 +0.57 X SDURATION - PASS/FAIL=3.69 + 0.57 x SDURATION - P(PASS/F(FAIL)=3.69+ 0.57 X SDURATION - PASS/FAIL= 0.57 + 3.69 x SDURATION - ln{P(PASS/F(FAIL)}=0.57 + 3.69 X SDURATION - ln{P(PASS/F(FAIL)}= 3.69+ 0.57 X SDURATIONTRUE or False 1)Logistic regression cannot be employed when the dependent variable is binary. 2)In the average linkage clustering, the distance between two clusters is defined as the average of distances between all pairs of objects, where each pair is made up of one object from each group. 3)As Monte Carlo simulation is essentially statistical sampling, the larger the number of trials used, the more precise is the result. 4)Monte Carlo simulation is an inappropriate tool to analyze cash budgets because of the inherent uncertainty of the sales forecasts on which most cash budgets are based 5)Any solution that satisfies all constraints of a problem is called a feasible solution..
- The prices of stocks or other financial instruments are often modeled with a lognormal distribution. An investor is considering purchasing stock in one of two companies, A or B. The price of a share of stock today is $1 for both companies. For company A, the value of the stock one year from now is modeled as lognormal with parameters μ = 0.05 and σ = 0.1. For company B, the value of the stock one year from now is modeled as lognormal with parameters μ = 0.02 and σ = 0.2. a) Find the mean of the price of one share of company A one year from now. b) Find the probability that the price of one share of company A one year from now will be greater than $1.20. c) Find the mean of the price of one share of company B one year from now. d) Find the probability that the price of one share of company B one year from now will be greater than $1.20.A jar contains 7 gold, 5 silver, 4 blue, 3 red, and 1 green marbles. Two marbles are to be randomly drawn from the jar. What is the probability a sliver marble is drawn, not returned to the jar, and then a blue marble is drawn? Given the power regression model y = 25x^1.2, which is the linear regression model after transforming to a log-log graph?Consider an island that is separated from the mainland, which contains a pool of potential colonizer species. The MacArthur-Wilson theory of biogeography† hypothesizes that some species from the mainland will migrate to the island but that increasing competition on the island will lead to species extinction. It further hypothesizes that both the rate of migration and the rate of extinction of species are exponential functions, and that an equilibrium occurs when the rate of extinction matches the rate of immigration. This equilibrium point is thought to be the point at which immigration and extinction stabilize. Suppose that, for a certain island near the mainland, the rate of immigration of new species is given by the following formula. I = 5.0 ✕ 0.93t species per year Also suppose that the rate of species extinction on the island is given by the following formula. E = 1.7 ✕ 1.1t species per year According to the MacArthur-Wilson theory, how long will be required for stabilization…
- A population of 200 bass released in a lake began growing at a rate of 100 fish/yr. A second assessment performed at a later date found that there were 400 fish and the population was growing at a rate of 160 fish/yr. (Assume logistic growth dynamics.) (a) Estimate the equilibrium population size without harvesting.Suppose a new magazine initially sells 600 copies per month. Research indicates that a vigorous advertising campaign could increase sales by 40% each month if our market were unlimited. But research also indicates that magazine sales in our area are unlikely to exceed 2400 per month. Make a logistic model of projected magazine sales. a) N = 600 / 1+3e^-0.336t b) N = 2400 / 1+3e^-0.336t c) N = 40 / 1+3e^-0.336t d) N = 2400 / 1+40e^-0.336tThe market research department of a soft drink manufacturer is investigating the effectiveness of a price discount coupon on the purchase of a two-liter beverage product. A sample of 5500 customers was given coupons for varying-price discounts between 5 and 25 cents. The response variable was the number of coupons in each price discount category redeemed after one month. The data is in the picture. a. Fit a logistic regression model to the data. Use a simple linear regression model as the structure for the linear predictor.b. Does the model deviance indicate that the logistic regression model from part a is adequate?c. Draw a graph of the data and the fitted logistic regression model.d. Expand the linear predictor to include a quadratic term. Is there any evidence that this quadratic term is required in the model?
