n a given neighborhood, and let y represent the number of entry-level jobs in the same neighborhood. A sample of six Denver neighborhoods gave the following information (units in hundreds of jobs). x: 16, 33, 50, 28, 50, 25 y: 2, 3, 6, 5, 9, 3 Part 1: If there exists a linear relationship between x and y, find the equation of the least-squares line, and interpret the slope a.) ŷ= -0.5526+ 0.3023x The slope is -0.5526. For every unit increase in the total number of jobs in a given neighborhood, the number of entry-level jobs in this neighborhood is expecte


An economist is studying the job market in Denver-area neighborhoods. Let x represent the total number of jobs in a given neighborhood, and let y represent the number of entry-level jobs in the same neighborhood. A sample of six Denver neighborhoods gave the following information (units in hundreds of jobs).
x: 16, 33, 50, 28, 50, 25
y: 2, 3, 6, 5, 9, 3
Part 1:
If there exists a linear relationship between x and y, find the equation of the least-squares line, and interpret the slope
a.) ŷ= -0.5526+ 0.3023x
The slope is -0.5526. For every unit increase in the total number of jobs in a given neighborhood, the number of entry-level jobs in this neighborhood is expected to decrease by 0.5526 units.
b.) ŷ= -0.5526+ 0.3023x
The slope is 0.3023. For every unit increase in the total number of jobs in a given neighborhood, the number of entry-level jobs in this neighborhood is expected to increase by 0.3023 units.
c.) ŷ= -0.7483+ 0.1608x
The slope is 0.1608. For every unit increase in the total number of jobs in a given neighborhood, the number of entry-level jobs in this neighborhood is expected to increase 0.1608 units.
d.) ŷ= -0.7483+ 0.1608x
The slope is -0.7483. For every unit increase in the total number of jobs in a given neighborhood, the number of entry-level jobs in this neighborhood is expected to decrease by 0.7483 units.
Part 2:
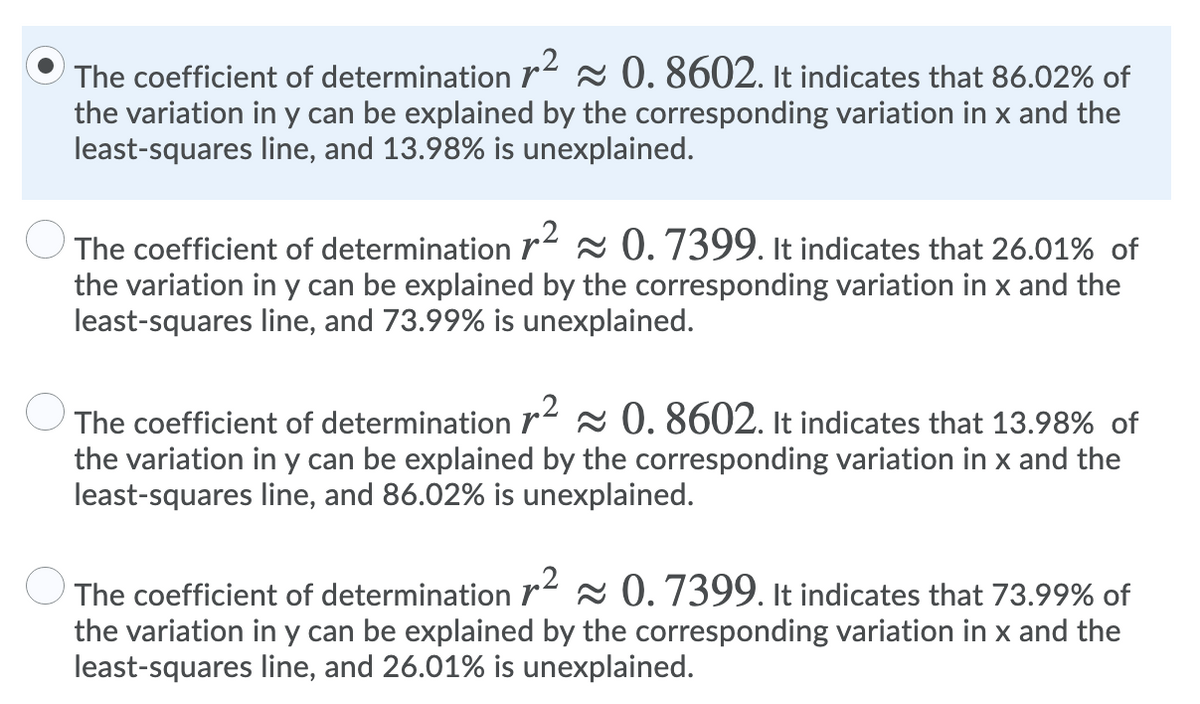
Find the value of the coefficient of determination . What percentage of the variation in y can be explained by the corresponding variation in x and the least-squares line? What percentage is unexplained? (View attached image for multiple choice options)
Part 3:
For a neighborhood with x = 40 jobs, how many are predicted to be entry-level jobs? ( rounded up to the nearest whole number)
a.) 6
b.) 12
c.) 9
d.) 4
Part 4:
How reliable do you think the prediction is for the previous question?
a.) The prediction should be less reliable as the
b.) The prediction should be less reliable as it involves extrapolation
c.) The prediction should be fairly reliable. The prediction involves interpolation, and the scatter diagram shows that the data points are clustered around the least-squares line.
d.) The prediction should be less reliable. The prediction involves interpolation, and the scatter diagram shows that the data points are spread out around the least-squares line.


Trending now
This is a popular solution!

Step by step
Solved in 4 steps with 2 images


