N1 fx Vertical G H K M R 24 Income taxes paid 25 Interest paid 26 Cash provided by operating activities 27 investing activities 28 Additions to property, plant and equipment 29 Capital expenditures 30 Additions to program rights 31 Changes in non-cash working capital related to property, plant and equipment and intangible assets 32 Acquisitions and other strategic transactions, net of cash acquired 33 Other 34 Cash used in investing activities 35 Financing activities 36 Net proceeds received on short-term borrowings 37 Net repayment of long-term debt 38 Net proceeds (payments) on settlement of debt derivatives and forward contracts Net repayments on short-term borrowings Net (repayment) issuance of long-term debt 41 Net (payment) proceeds on settlement of debt derivatives and forward contracts 42 Transaction costs incurred Principal payments of lease liabilities Repurchase of Class 8 Non-Voting Shares 45 Dividends paid 46 Other 47 Cash used in financing activities 48 Change in cash and cash equivalents 49 Cash and cash equivalents, beginning of vear 50 (Bank advances) cash and cash equivalents, end of year -184 -295 -475 370 400 -3.68% -5.91% -8.94% -8.64% -6.85N -15.41% -15.14% -13.84% -13.37% -13.33% 79.24% 74.13% 71.63% 77.46% -771 -756 -735 -726 -779 3747 3957 3938 4288 4526 74.88% -2440 -2352 -48.76% -47.10% 0.00% 0.00% 0.00% -2436 -2790 -2807 Plot Area 44 46 59 -54 60 -1.28% 092% -1.11% -1.07% -1.03% -116 -103 109 -125 -35 -2.32% -2.06% 2.05% 1.98% 0.60% -1077 -184 -1731 -21.52% 0.00% -3.46% -3.35% -29.63% -70 45 -1.09% -60 -2630 25 21 -4612 -1.40% 0.90% -113% 0.36% -3767 -2456 -2944 -75.28% -49.18% 49.51% 47.84% -78.93% 858 508 30 -1034 -823 2184 -79 388 -121 39 42 0.84% 0.00% 0.00% 0.00% 0.00% 40 754 -538 15.07N -10.77% 0.00N 0.00N 0.00N 129 45 2.58% 0.90% 0.00% 0.00% 0.00% -17 -18 61 0.18% -0.34% 0.00% 0.00% -1.04% 43 167 44 655 977 988 -988 -988 -1016 -19.52% -19.78% -18.60N -17.97% -17.39% 19 175 -145 -1583 -1243 -933 -2.90% -3170N -23.40N 22.61% 3.00% 1.52% 6.93% -165 82 65 411 89 -3.30% -1.64% 122% 118% 176 405 -134% 11 -71 -71 -6 6 3.52% 022% -129% 11 405 494 0.22% -1.42% 011% 011N 8.45% 51 52 53 Statements of Cash Flows 54 55 000
N1 fx Vertical G H K M R 24 Income taxes paid 25 Interest paid 26 Cash provided by operating activities 27 investing activities 28 Additions to property, plant and equipment 29 Capital expenditures 30 Additions to program rights 31 Changes in non-cash working capital related to property, plant and equipment and intangible assets 32 Acquisitions and other strategic transactions, net of cash acquired 33 Other 34 Cash used in investing activities 35 Financing activities 36 Net proceeds received on short-term borrowings 37 Net repayment of long-term debt 38 Net proceeds (payments) on settlement of debt derivatives and forward contracts Net repayments on short-term borrowings Net (repayment) issuance of long-term debt 41 Net (payment) proceeds on settlement of debt derivatives and forward contracts 42 Transaction costs incurred Principal payments of lease liabilities Repurchase of Class 8 Non-Voting Shares 45 Dividends paid 46 Other 47 Cash used in financing activities 48 Change in cash and cash equivalents 49 Cash and cash equivalents, beginning of vear 50 (Bank advances) cash and cash equivalents, end of year -184 -295 -475 370 400 -3.68% -5.91% -8.94% -8.64% -6.85N -15.41% -15.14% -13.84% -13.37% -13.33% 79.24% 74.13% 71.63% 77.46% -771 -756 -735 -726 -779 3747 3957 3938 4288 4526 74.88% -2440 -2352 -48.76% -47.10% 0.00% 0.00% 0.00% -2436 -2790 -2807 Plot Area 44 46 59 -54 60 -1.28% 092% -1.11% -1.07% -1.03% -116 -103 109 -125 -35 -2.32% -2.06% 2.05% 1.98% 0.60% -1077 -184 -1731 -21.52% 0.00% -3.46% -3.35% -29.63% -70 45 -1.09% -60 -2630 25 21 -4612 -1.40% 0.90% -113% 0.36% -3767 -2456 -2944 -75.28% -49.18% 49.51% 47.84% -78.93% 858 508 30 -1034 -823 2184 -79 388 -121 39 42 0.84% 0.00% 0.00% 0.00% 0.00% 40 754 -538 15.07N -10.77% 0.00N 0.00N 0.00N 129 45 2.58% 0.90% 0.00% 0.00% 0.00% -17 -18 61 0.18% -0.34% 0.00% 0.00% -1.04% 43 167 44 655 977 988 -988 -988 -1016 -19.52% -19.78% -18.60N -17.97% -17.39% 19 175 -145 -1583 -1243 -933 -2.90% -3170N -23.40N 22.61% 3.00% 1.52% 6.93% -165 82 65 411 89 -3.30% -1.64% 122% 118% 176 405 -134% 11 -71 -71 -6 6 3.52% 022% -129% 11 405 494 0.22% -1.42% 011% 011N 8.45% 51 52 53 Statements of Cash Flows 54 55 000

Survey of Accounting (Accounting I)
8th Edition
ISBN:9781305961883
Author:Carl Warren
Publisher:Carl Warren
Chapter4: Accounting For Retail Operations
Section: Chapter Questions
Problem 4.6.2P

Related questions
Question
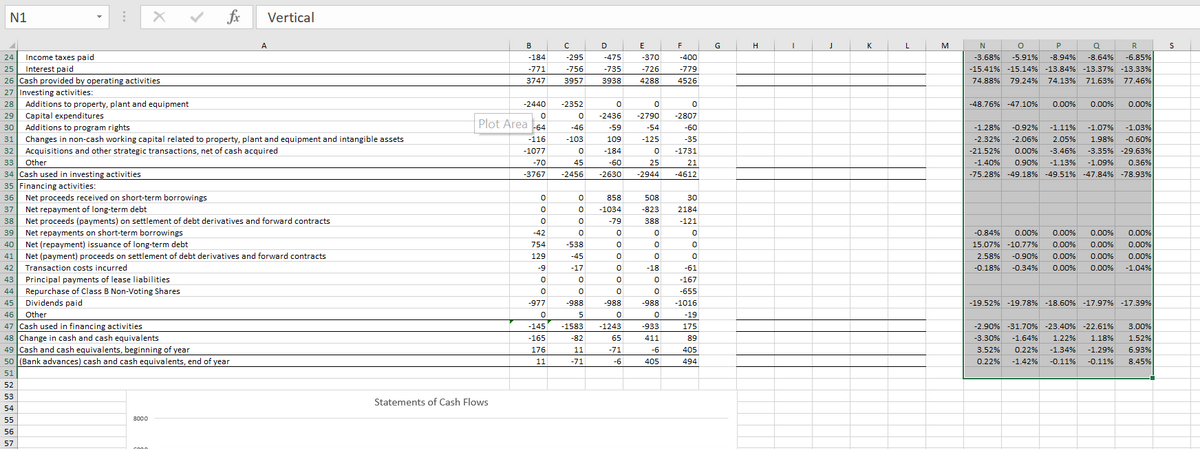
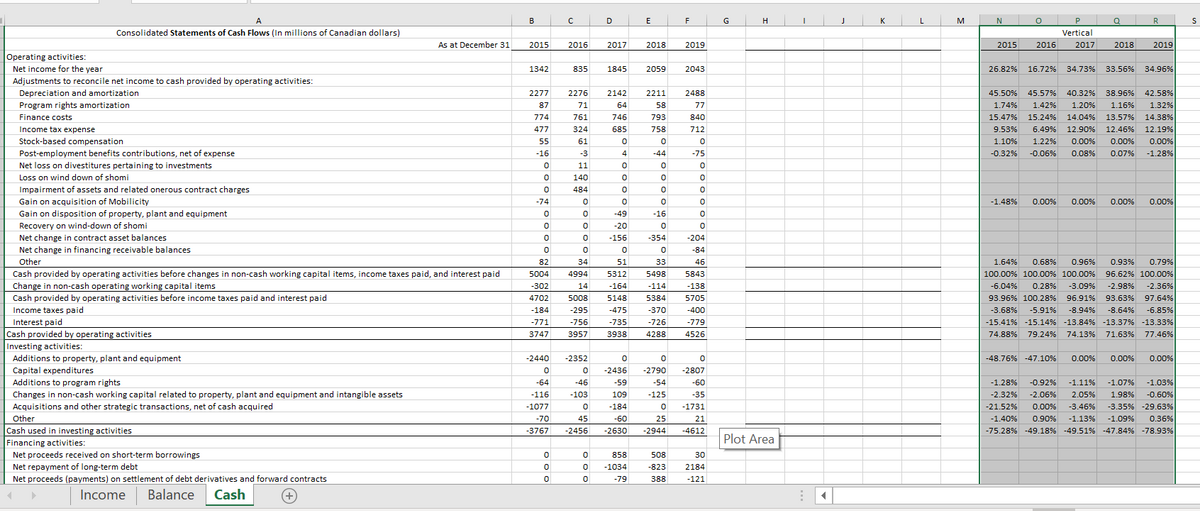
This is the vertical analysis of rogers communication company in cash flow. now write a written analysis of this calculative analysis of cash flow?
Transcribed Image Text:N1
fx
Vertical
A
B
E
F
G
K
M
N
P
Q
R
24 Income taxes paid
25 Interest paid
26 Cash provided by operating activities
27 Investing activities:
28 Additions to property, plant and equipment
-184
-295
-475
-370
-400
-3.68%
-5.91%
-8.94%
-8.64%
-6.85%
-771
-756
-735
-726
-779
-15.41% -15.14% -13.84% -13.37% -13.33%
3747
3957
3938
4288
4526
74.88% 79.24% 74.13% 71.63% 77.46%
-2440
-2352
-48.76% -47.10%
0.00%
0.00%
0.00%
29
Capital expenditures
-2436
-2790
-2807
30 Additions to program rights
Piot Area -64
-1.03%
-46
-59
-54
-60
-1.28%
-0.92%
-1.11%
-1.07%
31
Changes in non-cash working capital related to property, plant and equipment and intangible assets
-116
-103
109
-125
-35
-2.32%
-2.06%
2.05%
1.98%
-0.60%
-3.35% -29.63%
0.36%
-75.28% -49.18% -49.51% -47.84% -78.93%
32
Acquisitions and other strategic transactions, net of cash acquired
-1077
-184
-1731
-21.52%
0.00%
-3.46%
Other
34 Cash used in investing activities
35 Financing activities:
33
-70
45
-60
25
21
-1.40%
0.90%
-1.13%
-1.09%
-3767
-2456
-2630
-2944
-4612
36 Net proceeds received on short-term borrowings
858
508
30
37
Net repayment of long-term debt
-1034
-823
2184
38
Net proceeds (payments) on settlement of debt derivatives and forward contracts
-79
388
-121
39
Net repayments on short-term borrowings
-42
-0.84%
0.00%
0.00%
0.00%
0.00%
40
Net (repayment) issuance of long-term debt
754
-538
15.07% -10.77%
0.00%
0.00%
0.00%
41
Net (payment) proceeds on settlement of debt derivatives and forward contracts
129
-45
2.58%
-0.90%
0.00%
0.00%
0.00%
42
Transaction costs incurred
-9
-17
-18
-61
-0.18%
-0.34%
0.00%
0.00%
-1.04%
43
Principal payments of lease liabilities
-167
44
Repurchase of Class B Non-Voting Shares
-655
45
Dividends paid
-977
-988
-988
-988
-1016
-19.52% -19.78% -18.60% -17.97% -17.39%
Other
47 Cash used in financing activities
48 Change in cash and cash equivalents
46
5
-19
-145
-1583
-1243
-933
175
-2.90% -31.70% -23.40% -22.61%
3.00%
-165
-82
65
411
89
-3.30%
-1.64%
1.22%
1.18%
1.52%
49 Cash and cash equivalents, beginning of year
176
11
-71
-6
405
3.52%
0.22%
-1.34%
-1.29%
6.93%
50 (Bank advances) cash and cash equivalents, end of year
11
-71
-6
405
494
0.22%
-1.42%
-0.11%
-0.11%
8.45%
51
52
53
Statements of Cash Flows
54
55
8000
56
57
Transcribed Image Text:A
B
D
E
F
G
H
K
L
M
P
Q
R
Consolidated Statements of Cash Flows (In millions of Canadian dollars)
Vertical
As at December 31
2015
2016
2017
2018
2019
2015
2016
2017
2018
2019
Operating activities:
Net income for the year
Adjustments to reconcile net income to cash provided by operating activities:
1342
835
1845
2059
2043
26.82%
16.72%
34.73% 33.56%
34.96%
Depreciation and amortization
2277
2276
2142
2211
2488
45.50%
45.57%
40.32%
38.96%
42.58%
Program rights amortization
87
71
64
58
77
1.74%
1.42%
1.20%
1.16%
1.32%
Finance costs
774
761
746
793
840
15.47%
15.24%
14.04%
13.57%
14.38%
Income tax expense
477
324
685
758
712
9.53%
6.49% 12.90%
12.46%
12.19%
Stock-based compensation
55
61
1.10%
1.22%
0.00%
0.00%
0.00%
Post-employment benefits contributions, net of expense
-16
-3
4
-44
-75
-0.32%
-0.06%
0.08%
0.07%
-1.28%
Net loss on divestitures pertaining to investments
11
Loss on wind down of shomi
140
Impairment of assets and related onerous contract charges
484
Gain on acquisition of Mobilicity
-74
-1.48%
0.00%
0.00%
0.00%
0.00%
Gain on disposition of property, plant and equipment
-49
-16
Recovery on wind-down of shomi
-20
Net change in contract asset balances
-156
-354
-204
Net change in financing receivable balances
-84
Other
82
34
51
33
46
1.64%
0.68%
0.96%
0.93%
0.79%
Cash provided by operating activities before changes in non-cash working capital items, income taxes paid, and interest paid
5004
4994
5312
5498
5843
100.00% 100.00% 100.00%
96.62% 100.00%
Change in non-cash operating working capital items
-302
14
-164
-114
-138
-6.04%
0.28%
-3.09%
-2.98%
-2.36%
Cash provided by operating activities before income taxes paid and interest paid
4702
5008
5148
5384
5705
93.96% 100.28% 96.91% 93.63% 97.64%
Income taxes paid
Interest paid
Cash provided by operating activities
Investing activities:
Additions to property, plant and equipment
-184
-295
-475
-370
-400
-3.68%
-5.91%
-8.94%
-8.64%
-6.85%
-15.41% -15.14% -13.84% -13.37% -13.33%
71.63% 77.46%
-771
-756
-735
-726
-779
3747
3957
3938
4288
4526
74.88%
79.24%
74.13%
-2440
-2352
-48.76% -47.10%
0.00%
0.00%
0.00%
Capital expenditures
Additions to program rights
-2436
-2790
-2807
-64
-46
-59
-54
-60
-1.28%
-0.92%
-1.11%
-1.07%
-1.03%
Changes in non-cash working capital related to property, plant and equipment and intangible assets
-116
-103
109
-125
-35
-2.32%
-2.06%
2.05%
1.98%
-0.60%
-3.35% -29.63%
0.36%
-75.28% -49.18% -49.51% -47.84% -78.93%
Acquisitions and other strategic transactions, net of cash acquired
-1077
-184
-1731
-21.52%
0.00%
-3.46%
Other
Cash used in investing activities
Financing activities:
-70
45
-60
25
21
-1.40%
0.90%
-1.13%
-1.09%
-3767
-2456
-2630
-2944
-4612
Plot Area
Net proceeds received on short-term borrowings
858
508
30
Net repayment of long-term debt
-1034
-823
2184
Net proceeds (payments) on settlement of debt derivatives and forward contracts
-79
388
-121
Income
Balance
Cash
Expert Solution
This question has been solved!
Explore an expertly crafted, step-by-step solution for a thorough understanding of key concepts.

Step by step
Solved in 2 steps

Knowledge Booster


Learn more about
Need a deep-dive on the concept behind this application? Look no further. Learn more about this topic, accounting and related others by exploring similar questions and additional content below.Recommended textbooks for you
Survey of Accounting (Accounting I)
Accounting
ISBN:
9781305961883
Author:
Carl Warren
Publisher:
Cengage Learning

Cornerstones of Financial Accounting
Accounting
ISBN:
9781337690881
Author:
Jay Rich, Jeff Jones
Publisher:
Cengage Learning

Financial Accounting: The Impact on Decision Make…
Accounting
ISBN:
9781305654174
Author:
Gary A. Porter, Curtis L. Norton
Publisher:
Cengage Learning
Survey of Accounting (Accounting I)
Accounting
ISBN:
9781305961883
Author:
Carl Warren
Publisher:
Cengage Learning
Cornerstones of Financial Accounting
Accounting
ISBN:
9781337690881
Author:
Jay Rich, Jeff Jones
Publisher:
Cengage Learning
Financial Accounting: The Impact on Decision Make…
Accounting
ISBN:
9781305654174
Author:
Gary A. Porter, Curtis L. Norton
Publisher:
Cengage Learning


Managerial Accounting
Accounting
ISBN:
9781337912020
Author:
Carl Warren, Ph.d. Cma William B. Tayler
Publisher:
South-Western College Pub

College Accounting, Chapters 1-27
Accounting
ISBN:
9781337794756
Author:
HEINTZ, James A.
Publisher:
Cengage Learning,