Namefobiana Bosccon MAC1105 - HW Handout 4 9. The graph represents a power function that has an even/odd exponent. dd 10.The graph represents a power function that has a positive/negative exponent. 11.The numerical coefficient of this power function is positive/negative. 12.Find the domain: (use interval notation) 13.Find the range: (use interval notation) 14.The function is increasing/decreasing on its domain. 15.The equation for this power function is a(n) direct/inverse proportionality statement. 16.As x → 00, f(x) → 17. Give the intervals over which the function is negative.
Namefobiana Bosccon MAC1105 - HW Handout 4 9. The graph represents a power function that has an even/odd exponent. dd 10.The graph represents a power function that has a positive/negative exponent. 11.The numerical coefficient of this power function is positive/negative. 12.Find the domain: (use interval notation) 13.Find the range: (use interval notation) 14.The function is increasing/decreasing on its domain. 15.The equation for this power function is a(n) direct/inverse proportionality statement. 16.As x → 00, f(x) → 17. Give the intervals over which the function is negative.

Chapter3: Functions
Section3.2: Domain And Range
Problem 4SE: When describing sets of numbers using interval notation, when do you use a parenthesis and when do...

Related questions
Question
solve this page
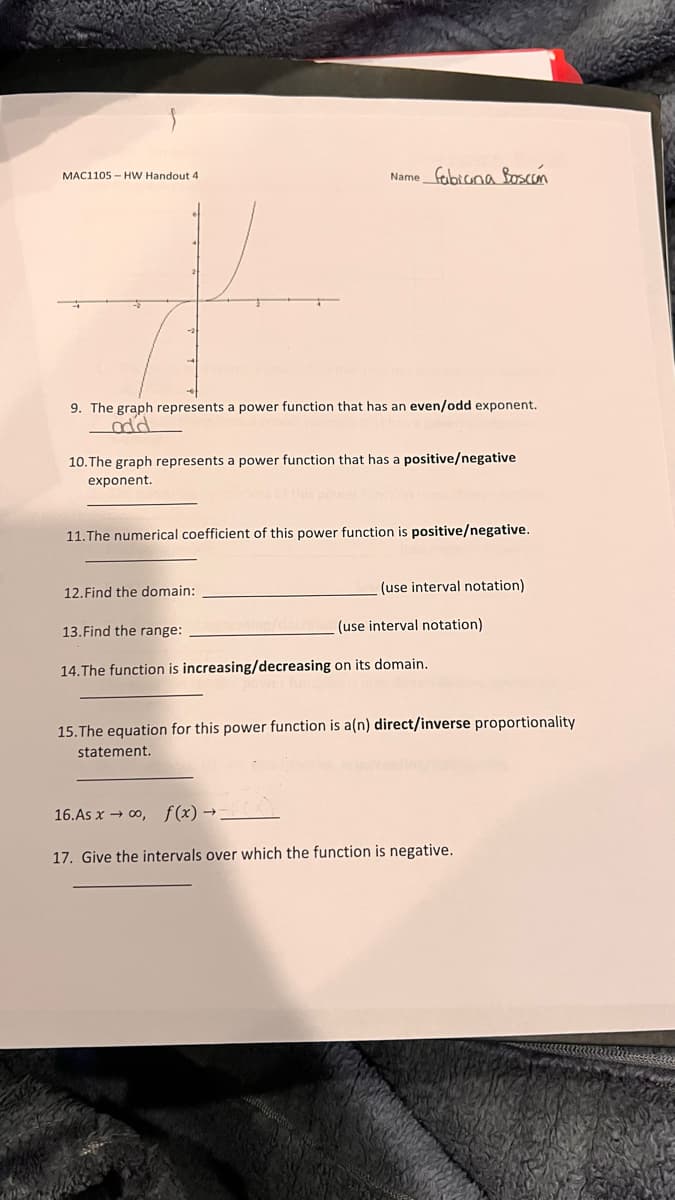
Transcribed Image Text:Name fobiona Boscon
MAC1105 - HW Handout 4
9. The graph represents a power function that has an even/odd exponent.
10.The graph represents a power function that has a positive/negative
exponent.
11.The numerical coefficient of this power function is positive/negative.
12.Find the domain:
(use interval notation)
13.Find the range:
(use interval notation)
14.The function is increasing/decreasing on its domain.
15.The equation for this power function is a(n) direct/inverse proportionality
statement.
16.As x → 0, f(x) →.
17. Give the intervals over which the function is negative.
Expert Solution
This question has been solved!
Explore an expertly crafted, step-by-step solution for a thorough understanding of key concepts.

This is a popular solution!

Trending now
This is a popular solution!

Step by step
Solved in 2 steps with 2 images

Recommended textbooks for you