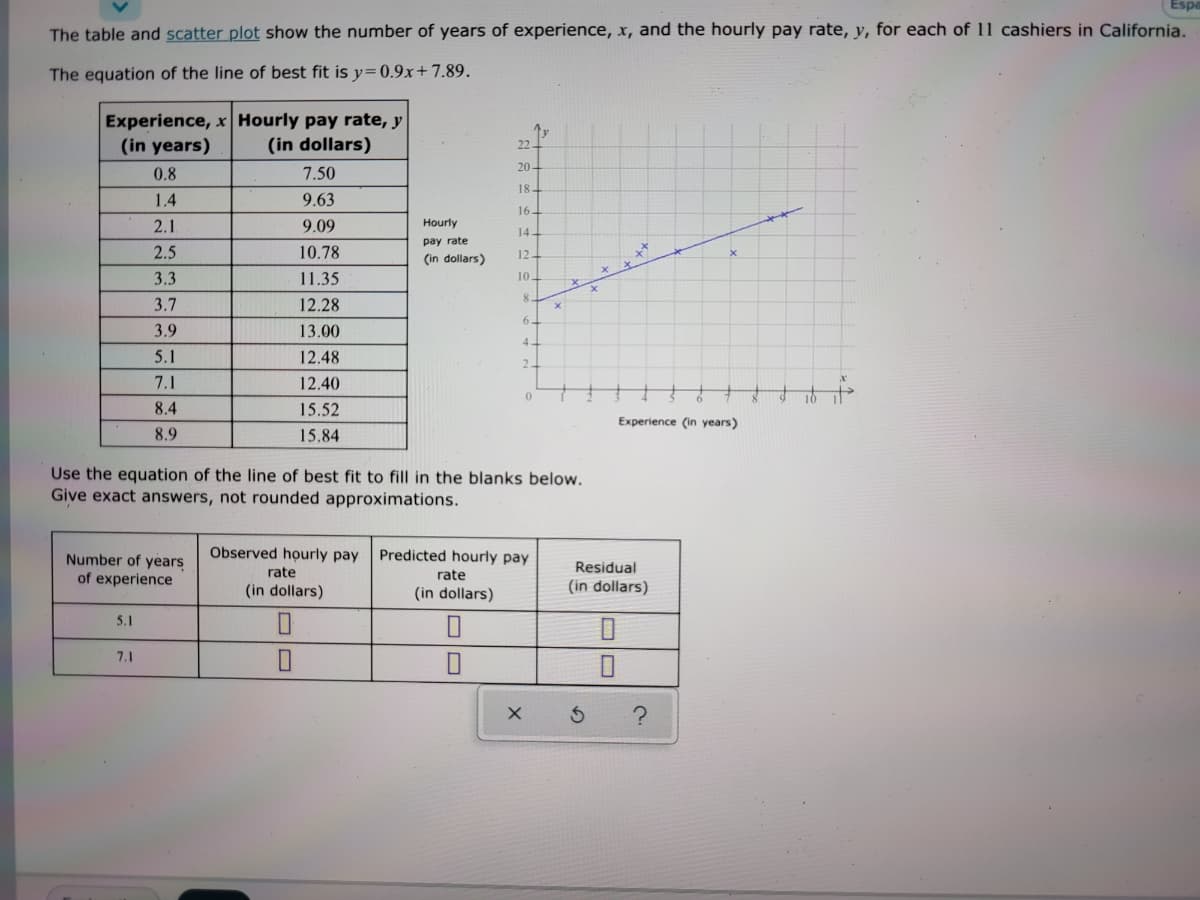
The table and scatter plot show the number of years of experience, x, and the hourly pay rate, y, for each of 11 cashiers in California. The equation of the line of best fit is y=0.9x+7.89. Experience, x Hourly pay rate, y (in years) (in dollars) 22- 20- 0.8 7.50 18- 1.4 9.63 16. 2.1 9.09 Hourly 14 pay rate 2.5 10.78 (in dollars) 12. 3.3 11.35 10. 3.7 12.28 6. 3.9 13.00 4. 5.1 12.48 2. 7.1 12.40 to 8.4 15.52 Experience (in years) 8.9 15.84 Use the equation of the line of best fit to fill in the blanks below. Give exact answers, not rounded approximations. Observed hourly pay Predicted hourly pay Number of years of experience Residual (in dollars) rate rate (in dollars) (in dollars) 5.1 7.1
The table and scatter plot show the number of years of experience, x, and the hourly pay rate, y, for each of 11 cashiers in California. The equation of the line of best fit is y=0.9x+7.89. Experience, x Hourly pay rate, y (in years) (in dollars) 22- 20- 0.8 7.50 18- 1.4 9.63 16. 2.1 9.09 Hourly 14 pay rate 2.5 10.78 (in dollars) 12. 3.3 11.35 10. 3.7 12.28 6. 3.9 13.00 4. 5.1 12.48 2. 7.1 12.40 to 8.4 15.52 Experience (in years) 8.9 15.84 Use the equation of the line of best fit to fill in the blanks below. Give exact answers, not rounded approximations. Observed hourly pay Predicted hourly pay Number of years of experience Residual (in dollars) rate rate (in dollars) (in dollars) 5.1 7.1

Glencoe Algebra 1, Student Edition, 9780079039897, 0079039898, 2018
18th Edition
ISBN:9780079039897
Author:Carter
Publisher:Carter
Chapter4: Equations Of Linear Functions
Section4.6: Regression And Median-fit Lines
Problem 19PFA

Related questions
Question
Transcribed Image Text:The table and scatter plot show the number of years of experience, x, and the hourly pay rate, y, for each of 11 cashiers in California.
The equation of the line of best fit is y= 0.9x+7.89.
Experience, x Hourly pay rate, y
(in years)
(in dollars)
22-
20-
0.8
7.50
18-
1.4
9.63
16.
2.1
9.09
Hourly
14-
pay rate
2.5
10.78
Çin dollars)
12-
3.3
11.35
10.
3.7
12.28
6.
3.9
13.00
4.
5.1
12.48
2.
7.1
12.40
to
8.4
15.52
Experience (in years)
8.9
15.84
Use the equation of the line of best fit to fill in the blanks below.
Give exact answers, not rounded approximations.
Observed hourly pay
Predicted hourly pay
Number of years
of experience
Residual
(in dollars)
rate
rate
(in dollars)
(in dollars)
5.1
7.1
Expert Solution
Step 1
We have to solve the question using table and equation .

Trending now
This is a popular solution!

Step by step
Solved in 2 steps with 1 images

Recommended textbooks for you
Glencoe Algebra 1, Student Edition, 9780079039897…
Algebra
ISBN:
9780079039897
Author:
Carter
Publisher:
McGraw Hill

Intermediate Algebra
Algebra
ISBN:
9781285195728
Author:
Jerome E. Kaufmann, Karen L. Schwitters
Publisher:
Cengage Learning

Elementary Algebra
Algebra
ISBN:
9780998625713
Author:
Lynn Marecek, MaryAnne Anthony-Smith
Publisher:
OpenStax - Rice University
Glencoe Algebra 1, Student Edition, 9780079039897…
Algebra
ISBN:
9780079039897
Author:
Carter
Publisher:
McGraw Hill
Intermediate Algebra
Algebra
ISBN:
9781285195728
Author:
Jerome E. Kaufmann, Karen L. Schwitters
Publisher:
Cengage Learning
Elementary Algebra
Algebra
ISBN:
9780998625713
Author:
Lynn Marecek, MaryAnne Anthony-Smith
Publisher:
OpenStax - Rice University

College Algebra (MindTap Course List)
Algebra
ISBN:
9781305652231
Author:
R. David Gustafson, Jeff Hughes
Publisher:
Cengage Learning


Elementary Geometry For College Students, 7e
Geometry
ISBN:
9781337614085
Author:
Alexander, Daniel C.; Koeberlein, Geralyn M.
Publisher:
Cengage,