Nationally, about 11% of the total U.S. wheat crop is destroyed each year by hall.t An Insurance company is studying wheat haill damage claims in a county in Colorado. A random sample of 16 claims In the county reported the percentage of their wheat lost to hail. 17 8 11 9 12 18 9 8 25 18 15 7 13 12 13 3 The sample mean is x= 12.4%. Let x be a random variable that represents the percentage of wheat crop in that county lost to hail. Assume that x has a normal distribution and a 5.0%. Do these data indicate that the percentage of wheat crop lost to hail in that county is different (elther way) from the national mean of 11%? Use a- 0.01.
Nationally, about 11% of the total U.S. wheat crop is destroyed each year by hall.t An Insurance company is studying wheat haill damage claims in a county in Colorado. A random sample of 16 claims In the county reported the percentage of their wheat lost to hail. 17 8 11 9 12 18 9 8 25 18 15 7 13 12 13 3 The sample mean is x= 12.4%. Let x be a random variable that represents the percentage of wheat crop in that county lost to hail. Assume that x has a normal distribution and a 5.0%. Do these data indicate that the percentage of wheat crop lost to hail in that county is different (elther way) from the national mean of 11%? Use a- 0.01.

Holt Mcdougal Larson Pre-algebra: Student Edition 2012
1st Edition
ISBN:9780547587776
Author:HOLT MCDOUGAL
Publisher:HOLT MCDOUGAL
Chapter11: Data Analysis And Probability
Section: Chapter Questions
Problem 8CR

Related questions

Question
100%
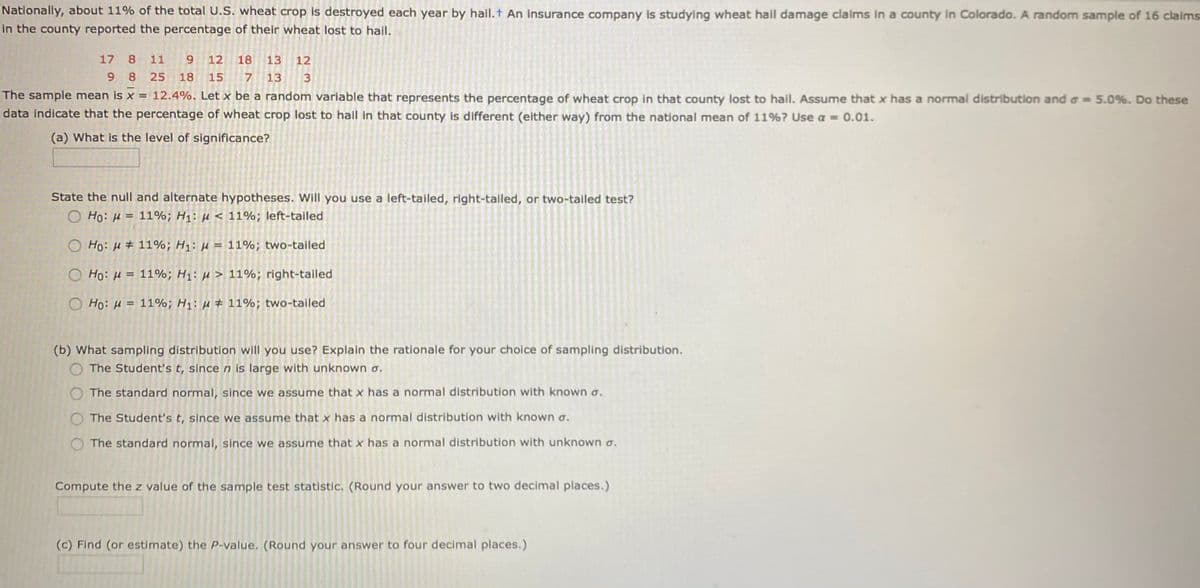
Transcribed Image Text:Nationally, about 11% of the total U.S. wheat crop is destroyed each year by hail.t An insurance company is studying wheat hail damage claims in a county in Colorado. A random sample of 16 claims
in the county reported the percentage of their wheat lost to hail.
17
8.
11
9.
12
18
13
12
9 8
25
18
15
13
3
The sample mean is x = 12.4%. Let x be a random variable that represents the percentage of wheat crop in that county lost to hail. Assume that x has a normal distribution and a= 5.0%. Do these
data indicate that the percentage of wheat crop lost to hail in that county is different (either way) from the national mean of 11%? Use a = 0.01.
(a) What is the level
significance?
State the null and alternate hypotheses. Will you use a left-tailed, right-tailed, or two-tailed test?
O Ho: H = 11%; H1: H < 11%; left-tailed
O Ho: H # 11%; H1: H = 11%; two-tailed
O Ho: H = 11%; H1: µ > 11%; right-tailed
O Ho: H = 11%; H1: µ ± 11%; two-tailed
(b) What sampling distribution will you use? Explain the rationale for your choice of sampling distribution.
O The Student's t, sincen is large with unknown o.
The standard normal, since we assume that x has a normal distribution with known o.
The Student's t, since we assume that x has a normal distribution with known o.
The standard normal, since we assume that x has a normal distribution with unknown a.
Compute the z value of the sample test statistic. (Round your answer to two decimal places.)
(c) Find (or estimate) the P-value. (Round your answer to four decimal places.)
Expert Solution
This question has been solved!
Explore an expertly crafted, step-by-step solution for a thorough understanding of key concepts.

This is a popular solution!

Trending now
This is a popular solution!

Step by step
Solved in 3 steps

Knowledge Booster


Learn more about
Need a deep-dive on the concept behind this application? Look no further. Learn more about this topic, statistics and related others by exploring similar questions and additional content below.Recommended textbooks for you
Holt Mcdougal Larson Pre-algebra: Student Edition…
Algebra
ISBN:
9780547587776
Author:
HOLT MCDOUGAL
Publisher:
HOLT MCDOUGAL
Holt Mcdougal Larson Pre-algebra: Student Edition…
Algebra
ISBN:
9780547587776
Author:
HOLT MCDOUGAL
Publisher:
HOLT MCDOUGAL