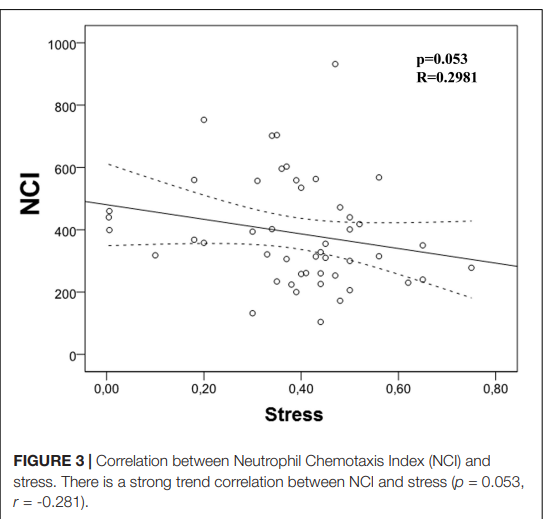
NCI 1000 800 600 400 200 8 00 O 0,00 O 9.0 0,20 O 8 00 0,40 Stress O 0,60 p=0.053 R=0.2981 0,80 FIGURE 3 | Correlation between Neutrophil Chemotaxis Index (NCI) and stress. There is a strong trend correlation between NCI and stress (p = 0.053, r = -0.281).
NCI 1000 800 600 400 200 8 00 O 0,00 O 9.0 0,20 O 8 00 0,40 Stress O 0,60 p=0.053 R=0.2981 0,80 FIGURE 3 | Correlation between Neutrophil Chemotaxis Index (NCI) and stress. There is a strong trend correlation between NCI and stress (p = 0.053, r = -0.281).

Basic Clinical Laboratory Techniques 6E
6th Edition
ISBN:9781133893943
Author:ESTRIDGE
Publisher:ESTRIDGE
Chapter3: Basic Hemostasis
Section3.4: Prothrombin Time
Problem 14RQ

Related questions

Question
please help explain this chart ( discribe in detail what it is saying)
Transcribed Image Text:NCI
1000
800
600-
400-
200-
100 o
8
0,00
O
O
9.0
0,20
O
8
00
O
0,40
Stress
O
0,60
p=0.053
R=0.2981
O
0,80
FIGURE 3 | Correlation between Neutrophil Chemotaxis Index (NCI) and
stress. There is a strong trend correlation between NCI and stress (p = 0.053,
r = -0.281).
Expert Solution
This question has been solved!
Explore an expertly crafted, step-by-step solution for a thorough understanding of key concepts.

Step by step
Solved in 3 steps

Knowledge Booster


Learn more about
Need a deep-dive on the concept behind this application? Look no further. Learn more about this topic, biology and related others by exploring similar questions and additional content below.Recommended textbooks for you
Essentials of Pharmacology for Health Professions
Nursing
ISBN:
9781305441620
Author:
WOODROW
Publisher:
Cengage
Essentials of Pharmacology for Health Professions
Nursing
ISBN:
9781305441620
Author:
WOODROW
Publisher:
Cengage

Biology 2e
Biology
ISBN:
9781947172517
Author:
Matthew Douglas, Jung Choi, Mary Ann Clark
Publisher:
OpenStax