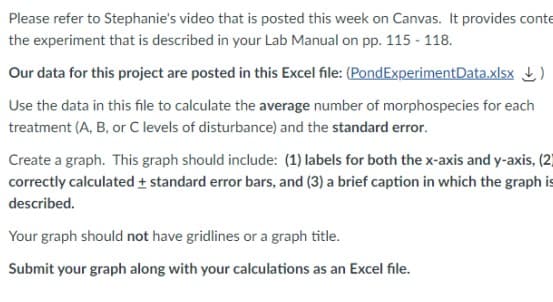
Please refer to Stephanie's video that is posted this week on Canvas. It provides conte the experiment that is described in your Lab Manual on pp. 115 - 118. Our data for this project are posted in this Excel file: (PondExperimentData.xlsx) Use the data in this file to calculate the average number of morphospecies for each treatment (A, B, or C levels of disturbance) and the standard error. Create a graph. This graph should include: (1) labels for both the x-axis and y-axis, (2) correctly calculated + standard error bars, and (3) a brief caption in which the graph is described. Your graph should not have gridlines or a graph title. Submit your graph along with your calculations as an Excel file.
Please refer to Stephanie's video that is posted this week on Canvas. It provides conte the experiment that is described in your Lab Manual on pp. 115 - 118. Our data for this project are posted in this Excel file: (PondExperimentData.xlsx) Use the data in this file to calculate the average number of morphospecies for each treatment (A, B, or C levels of disturbance) and the standard error. Create a graph. This graph should include: (1) labels for both the x-axis and y-axis, (2) correctly calculated + standard error bars, and (3) a brief caption in which the graph is described. Your graph should not have gridlines or a graph title. Submit your graph along with your calculations as an Excel file.

Glencoe Algebra 1, Student Edition, 9780079039897, 0079039898, 2018
18th Edition
ISBN:9780079039897
Author:Carter
Publisher:Carter
Chapter10: Statistics
Section: Chapter Questions
Problem 25SGR

Related questions
Question
Transcribed Image Text:Please refer to Stephanie's video that is posted this week on Canvas. It provides conte
the experiment that is described in your Lab Manual on pp. 115 - 118.
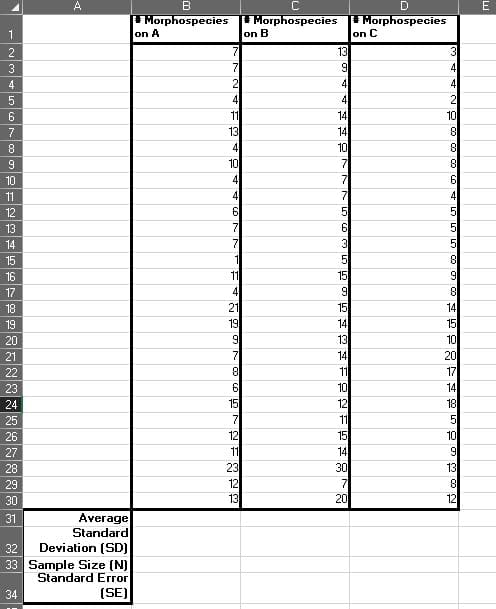
Our data for this project are posted in this Excel file: (PondExperimentData.xlsx)
Use the data in this file to calculate the average number of morphospecies for each
treatment (A, B, or C levels of disturbance) and the standard error.
Create a graph. This graph should include: (1) labels for both the x-axis and y-axis, (2)
correctly calculated + standard error bars, and (3) a brief caption in which the graph is
described.
Your graph should not have gridlines or a graph title.
Submit your graph along with your calculations as an Excel file.
Transcribed Image Text:-~35com
2
7
8
9
10
11
12
13
14
15
16
17
18
19
20
21
22
23
24
25
26
27
28
29
30
31
32
33
34
A
Average
Standard
Deviation (SD)
Sample Size (N)
Standard Error
(SE)
B
Morphospecies
on A
7
7
2
4
11
13
4
10
4
4
6
7
7
1
11
4
21
19
9
7
8
6
15
7
12
11
23
12
13
C
Morphospecies
on B
13
9
4
4
14
14
10
7
7
7
5
6
3
5
15
9
15
14
13
14
11
10
12
11
15
14
30
7
20
D
Morphospecies
on C
3
4
4
2
10
8
8
8
6
4
5
5
5
8
9
8
14
15
10
20
17
14
18
5
10
9
13
8
12
E
Expert Solution
This question has been solved!
Explore an expertly crafted, step-by-step solution for a thorough understanding of key concepts.

Step by step
Solved in 2 steps with 9 images

Follow-up Questions
Read through expert solutions to related follow-up questions below.
Follow-up Question
where are the x axsis and y axsis labelled ?
Solution
Recommended textbooks for you
Glencoe Algebra 1, Student Edition, 9780079039897…
Algebra
ISBN:
9780079039897
Author:
Carter
Publisher:
McGraw Hill
Glencoe Algebra 1, Student Edition, 9780079039897…
Algebra
ISBN:
9780079039897
Author:
Carter
Publisher:
McGraw Hill