nds of dollars) when the percentage of employment in STE O Mean Annu

Functions and Change: A Modeling Approach to College Algebra (MindTap Course List)
6th Edition
ISBN:9781337111348
Author:Bruce Crauder, Benny Evans, Alan Noell
Publisher:Bruce Crauder, Benny Evans, Alan Noell
Chapter3: Straight Lines And Linear Functions
Section3.CR: Chapter Review Exercises
Problem 15CR: Life Expectancy The following table shows the average life expectancy, in years, of a child born in...

Related questions
Question
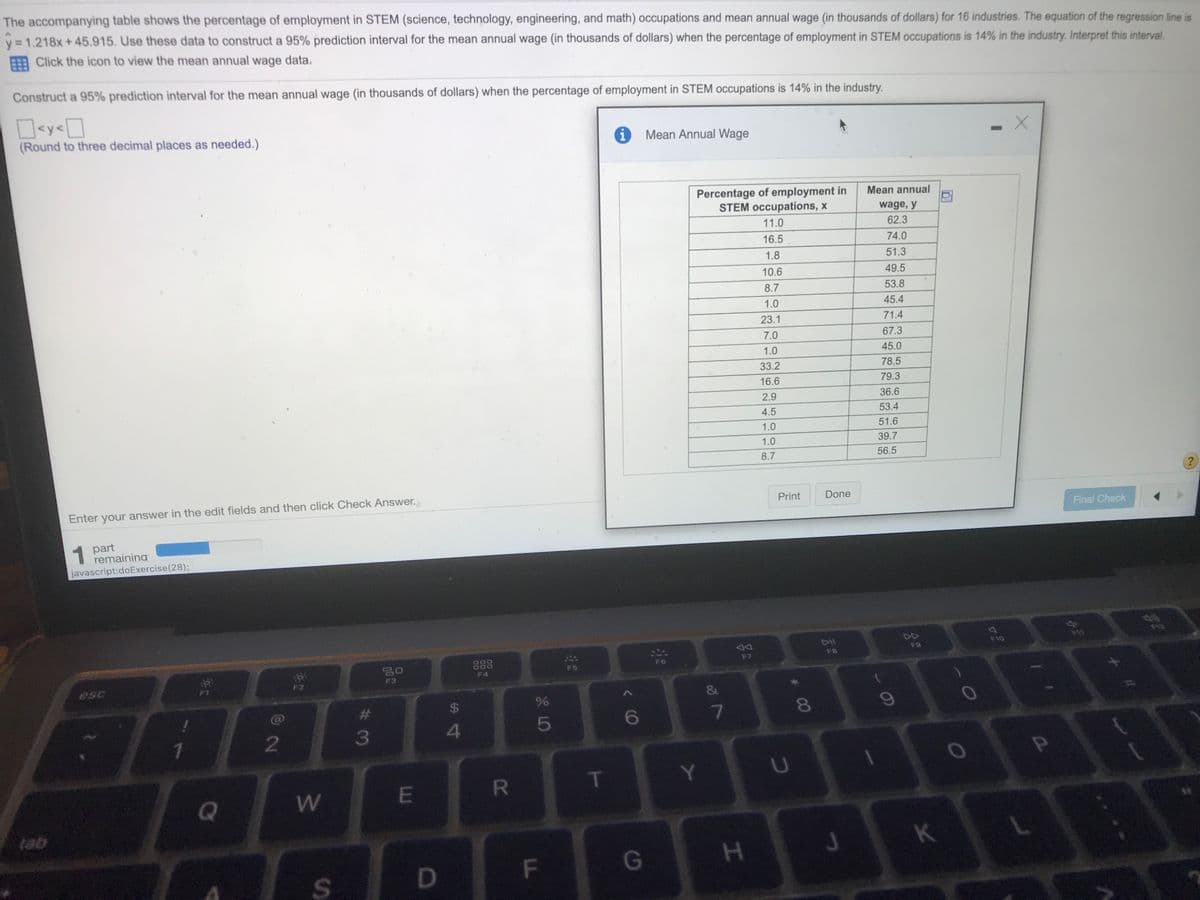
Transcribed Image Text:The accompanying table shows the percentage of employment in STEM (science, technology, engineering, and math) occupations and mean annual wage (in thousands of dollars) for 16 industries. The equation of the regression line is
y = 1.218x + 45.915. Use these data to construct a 95% prediction interval for the mean annual wage (in thousands of dollars) when the percentage of employment in STEM occupations is 14% in the industry. Interpret this interval.
A Click the icon to view the mean annual wage data.
Construct a 95% prediction interval for the mean annual wage (in thousands of dollars) when the percentage of employment in STEM occupations is 14% in the industry.
<y<
(Round to three decimal places as needed.)
Mean Annual Wage
Percentage of employment in
STEM occupations, x
Mean annual
wage, y
11.0
62.3
16.5
74.0
1.8
51.3
10.6
49.5
8.7
53.8
1.0
45.4
23.1
71.4
7.0
67.3
1.0
45.0
33.2
78.5
16.6
79.3
2.9
36.6
4.5
53.4
1.0
51.6
1.0
39.7
8.7
56.5
Enter your answer in the edit fields and then click Check Answer.
Print
Done
Final Check
1
1 part
remaining
javascript:doExercise(28);
DD
Dil
F10
F9
F8
F7
20
F5
F6
F4
F3
esc
F1
&
23
%$4
8.
6
7
3
4
R.
T
tab
K
F
G
工
co
Expert Solution
This question has been solved!
Explore an expertly crafted, step-by-step solution for a thorough understanding of key concepts.

Step by step
Solved in 2 steps

Knowledge Booster


Learn more about
Need a deep-dive on the concept behind this application? Look no further. Learn more about this topic, statistics and related others by exploring similar questions and additional content below.Recommended textbooks for you
Functions and Change: A Modeling Approach to Coll…
Algebra
ISBN:
9781337111348
Author:
Bruce Crauder, Benny Evans, Alan Noell
Publisher:
Cengage Learning


Glencoe Algebra 1, Student Edition, 9780079039897…
Algebra
ISBN:
9780079039897
Author:
Carter
Publisher:
McGraw Hill
Functions and Change: A Modeling Approach to Coll…
Algebra
ISBN:
9781337111348
Author:
Bruce Crauder, Benny Evans, Alan Noell
Publisher:
Cengage Learning
Glencoe Algebra 1, Student Edition, 9780079039897…
Algebra
ISBN:
9780079039897
Author:
Carter
Publisher:
McGraw Hill

Big Ideas Math A Bridge To Success Algebra 1: Stu…
Algebra
ISBN:
9781680331141
Author:
HOUGHTON MIFFLIN HARCOURT
Publisher:
Houghton Mifflin Harcourt

Holt Mcdougal Larson Pre-algebra: Student Edition…
Algebra
ISBN:
9780547587776
Author:
HOLT MCDOUGAL
Publisher:
HOLT MCDOUGAL