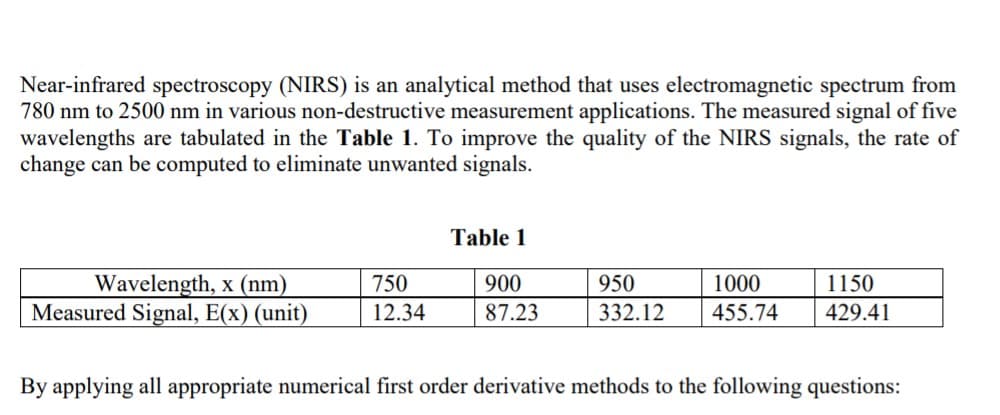
Near-infrared spectroscopy (NIRS) is an analytical method that uses electromagnetic spectrum from 780 nm to 2500 nm in various non-destructive measurement applications. The measured signal of five wavelengths are tabulated in the Table 1. To improve the quality of the NIRS signals, the rate of change can be computed to eliminate unwanted signals. Table 1 Wavelength, x (nm) Measured Signal, E(x) (unit) 750 900 950 1000 1150 12.34 87.23 332.12 455.74 429.41 By applying all appropriate numerical first order derivative methods to the following questions:
Near-infrared spectroscopy (NIRS) is an analytical method that uses electromagnetic spectrum from 780 nm to 2500 nm in various non-destructive measurement applications. The measured signal of five wavelengths are tabulated in the Table 1. To improve the quality of the NIRS signals, the rate of change can be computed to eliminate unwanted signals. Table 1 Wavelength, x (nm) Measured Signal, E(x) (unit) 750 900 950 1000 1150 12.34 87.23 332.12 455.74 429.41 By applying all appropriate numerical first order derivative methods to the following questions:

Chapter6: Exponential And Logarithmic Functions
Section6.8: Fitting Exponential Models To Data
Problem 3TI: Table 6 shows the population, in thousands, of harbor seals in the Wadden Sea over the years 1997 to...

Related questions
Question
Transcribed Image Text:(i)
Estimate the rate of change of the signal when the wavelength was 950 nm using an interval
of 50 nm.
Transcribed Image Text:Near-infrared spectroscopy (NIRS) is an analytical method that uses electromagnetic spectrum from
780 nm to 2500 nm in various non-destructive measurement applications. The measured signal of five
wavelengths are tabulated in the Table 1. To improve the quality of the NIRS signals, the rate of
change can be computed to eliminate unwanted signals.
Table 1
Wavelength, x (nm)
Measured Signal, E(x) (unit)
750
900
950
1000
1150
12.34
87.23
332.12
455.74
429.41
By applying all appropriate numerical first order derivative methods to the following questions:
Expert Solution
This question has been solved!
Explore an expertly crafted, step-by-step solution for a thorough understanding of key concepts.

Step by step
Solved in 2 steps with 1 images

Recommended textbooks for you

Linear Algebra: A Modern Introduction
Algebra
ISBN:
9781285463247
Author:
David Poole
Publisher:
Cengage Learning

Big Ideas Math A Bridge To Success Algebra 1: Stu…
Algebra
ISBN:
9781680331141
Author:
HOUGHTON MIFFLIN HARCOURT
Publisher:
Houghton Mifflin Harcourt
Linear Algebra: A Modern Introduction
Algebra
ISBN:
9781285463247
Author:
David Poole
Publisher:
Cengage Learning
Big Ideas Math A Bridge To Success Algebra 1: Stu…
Algebra
ISBN:
9781680331141
Author:
HOUGHTON MIFFLIN HARCOURT
Publisher:
Houghton Mifflin Harcourt

Algebra & Trigonometry with Analytic Geometry
Algebra
ISBN:
9781133382119
Author:
Swokowski
Publisher:
Cengage

Functions and Change: A Modeling Approach to Coll…
Algebra
ISBN:
9781337111348
Author:
Bruce Crauder, Benny Evans, Alan Noell
Publisher:
Cengage Learning

College Algebra
Algebra
ISBN:
9781305115545
Author:
James Stewart, Lothar Redlin, Saleem Watson
Publisher:
Cengage Learning