Need assistance with last question

Chapter4: Linear Functions
Section: Chapter Questions
Problem 30PT: For the following exercises, use Table 4 which shows the percent of unemployed persons 25 years or...

Related questions
Topic Video
Question
Need assistance with last question
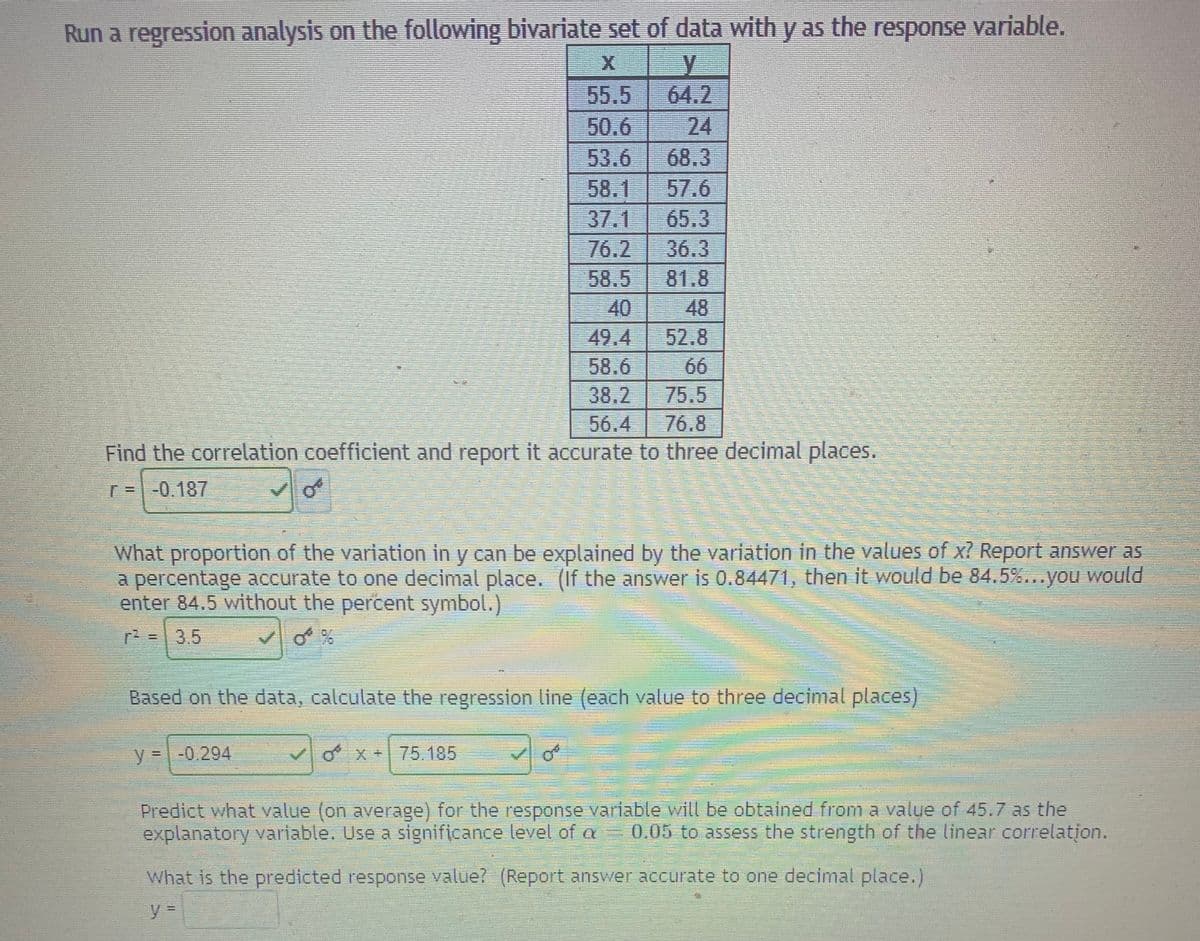
Transcribed Image Text:Run a regression analysis on the following bivariate set of data with y as the response variable.
55.5
50.6
53.6
58.1
37.1
76.2
58.5
40
49.4
58.6
38.2
56.4
64.2
24
68.3
57.6
65.3
36.3
81.8
48
52.8
66
75,5
76.8
Find the correlation coefficient and report it accurate to three decimal places.
r=-0.187
What proportion of the variation in y can be explained by the variation in the values of x? Report answer as
a percentage accurate to one decimal place. (If the answer is 0.84471, then it would be 84.5%..you would
enter 84.5 without the percent symbol.)
r=|3,5
%3D
Based on the data, calculate the regression line (each value to three decimal places)
y 3-0.294
ox + 75.185
Predict what value (on average) for the response variable will be obtained from a value of 45.7 as the
variable. Use a significance level of a 0.05 to assess the strength of the linear correlation.
What is the predicted response value? (Report answer accurate to one decimal place.)
%3D
Expert Solution
This question has been solved!
Explore an expertly crafted, step-by-step solution for a thorough understanding of key concepts.

This is a popular solution!

Trending now
This is a popular solution!

Step by step
Solved in 2 steps with 2 images

Knowledge Booster


Learn more about
Need a deep-dive on the concept behind this application? Look no further. Learn more about this topic, statistics and related others by exploring similar questions and additional content below.Recommended textbooks for you

Glencoe Algebra 1, Student Edition, 9780079039897…
Algebra
ISBN:
9780079039897
Author:
Carter
Publisher:
McGraw Hill

Functions and Change: A Modeling Approach to Coll…
Algebra
ISBN:
9781337111348
Author:
Bruce Crauder, Benny Evans, Alan Noell
Publisher:
Cengage Learning
Glencoe Algebra 1, Student Edition, 9780079039897…
Algebra
ISBN:
9780079039897
Author:
Carter
Publisher:
McGraw Hill
Functions and Change: A Modeling Approach to Coll…
Algebra
ISBN:
9781337111348
Author:
Bruce Crauder, Benny Evans, Alan Noell
Publisher:
Cengage Learning