nesis test of a single population mean with known population standard deviation (0), we can use either Geogebra or Minitab. In Geogebra, use the "Statistics" tab in the Probability Calculator in Geogebra. If needed, click the drop-down menu near the top and select "Z Test of a Mean" (this is the default). In Minitab, use Stat > Basic Statistics > 1 sample Z. Select Summarized Data from the drop-down menu. Check mark "Perform Hypothesis Test" and enter the hypothesized value. Click Options and select the appropriate alternative hypothesis. In either program, enter the sample mean, population standard deviation, and sample size. We'll use a sample with x 67.1, n = 36, and assume that o = 18.3. For a hypothesis test of Ho : u = 60 versus HA : µ > 60: • The given sample has a test statistic of 2.3279 • The P-value for the test is 0.01 For a hypothesis test of Ho :µ = 70 versus HA: u < 70: • The given sample has a test statistic of -0.95 • The P-value for the test is 0.171
nesis test of a single population mean with known population standard deviation (0), we can use either Geogebra or Minitab. In Geogebra, use the "Statistics" tab in the Probability Calculator in Geogebra. If needed, click the drop-down menu near the top and select "Z Test of a Mean" (this is the default). In Minitab, use Stat > Basic Statistics > 1 sample Z. Select Summarized Data from the drop-down menu. Check mark "Perform Hypothesis Test" and enter the hypothesized value. Click Options and select the appropriate alternative hypothesis. In either program, enter the sample mean, population standard deviation, and sample size. We'll use a sample with x 67.1, n = 36, and assume that o = 18.3. For a hypothesis test of Ho : u = 60 versus HA : µ > 60: • The given sample has a test statistic of 2.3279 • The P-value for the test is 0.01 For a hypothesis test of Ho :µ = 70 versus HA: u < 70: • The given sample has a test statistic of -0.95 • The P-value for the test is 0.171

Glencoe Algebra 1, Student Edition, 9780079039897, 0079039898, 2018
18th Edition
ISBN:9780079039897
Author:Carter
Publisher:Carter
Chapter10: Statistics
Section10.5: Comparing Sets Of Data
Problem 14PPS

Related questions
Question
100%
I need help with the the p value in the red box. The answer was wrong. All the others are right.
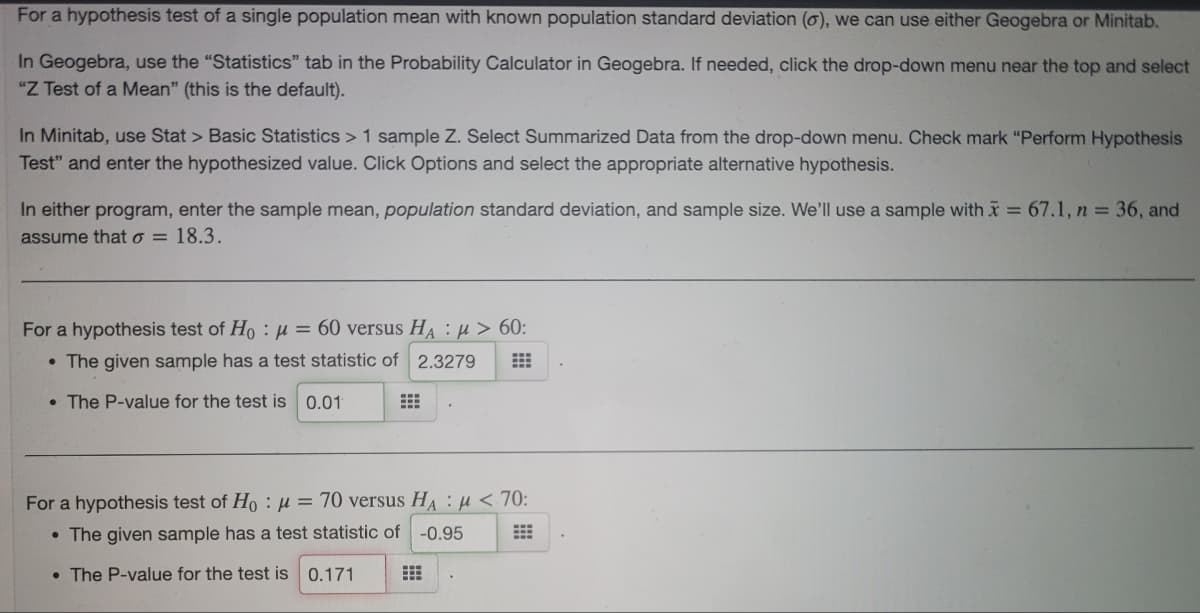
Transcribed Image Text:For a hypothesis test of a single population mean with known population standard deviation (o), we can use either Geogebra or Minitab.
In Geogebra, use the "Statistics" tab in the Probability Calculator in Geogebra. If needed, click the drop-down menu near the top and select
"Z Test of a Mean" (this is the default).
In Minitab, use Stat > Basic Statistics > 1 sample Z. Select Summarized Data from the drop-down menu. Check mark "Perform Hypothesis
Test" and enter the hypothesized value. Click Options and select the appropriate alternative hypothesis.
In either program, enter the sample mean, population standard deviation, and sample size. We'll use a sample with x = 67.1, n = 36, and
assume that o = 18.3.
For a hypothesis test of Ho : µ = 60 versus HA : µ > 60:
• The given sample has a test statistic of 2.3279
• The P-value for the test is 0.01
For a hypothesis test of Ho :µ = 70 versus HA : u < 70:
• The given sample has a test statistic of
-0.95
• The P-value for the test is 0.171
Expert Solution
This question has been solved!
Explore an expertly crafted, step-by-step solution for a thorough understanding of key concepts.

This is a popular solution!

Trending now
This is a popular solution!

Step by step
Solved in 2 steps

Recommended textbooks for you
Glencoe Algebra 1, Student Edition, 9780079039897…
Algebra
ISBN:
9780079039897
Author:
Carter
Publisher:
McGraw Hill

Glencoe Algebra 1, Student Edition, 9780079039897…
Algebra
ISBN:
9780079039897
Author:
Carter
Publisher:
McGraw Hill