nign schoOl students in a statistics 54 44 81 65 91 95 88 47 19 26 78 64 18 93 32 87 90 65 33 15 54 56 58 21 79 29 48 85 94 92 44 32 59 77 65 64 86 80 99 81 Construct a complete frequency distribution table of the scores Construct a frequency polygon. Draw an histo gram of the scores. Construct a pie chart. Construct a Cumulative Frequency greater than less thn ogive.
nign schoOl students in a statistics 54 44 81 65 91 95 88 47 19 26 78 64 18 93 32 87 90 65 33 15 54 56 58 21 79 29 48 85 94 92 44 32 59 77 65 64 86 80 99 81 Construct a complete frequency distribution table of the scores Construct a frequency polygon. Draw an histo gram of the scores. Construct a pie chart. Construct a Cumulative Frequency greater than less thn ogive.

Glencoe Algebra 1, Student Edition, 9780079039897, 0079039898, 2018
18th Edition
ISBN:9780079039897
Author:Carter
Publisher:Carter
Chapter10: Statistics
Section10.6: Summarizing Categorical Data
Problem 4AGP

Related questions
Question
MATH IN COLLEGE
COURSE: ICT
NOTE: THE PART 1,2 AND 3 ALREADY SOLVED. I NEED THE ANSWERS IN 4 AND 5. THANKS ^^
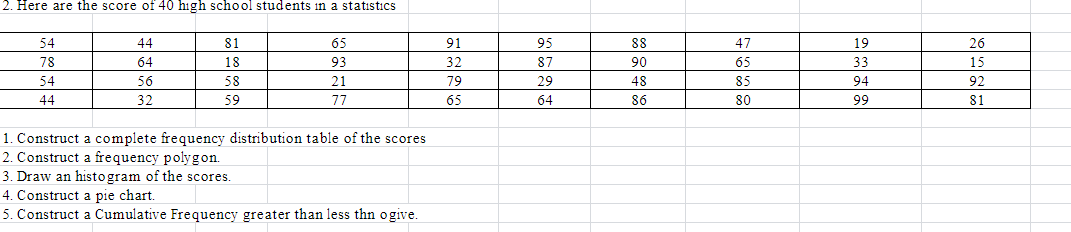
Transcribed Image Text:2. Here are the score of 40 high school students in a statistics
54
44
81
65
91
95
88
47
19
26
78
64
18
93
32
87
90
65
33
15
54
56
58
21
79
29
48
85
94
92
44
32
59
77
65
64
86
80
99
81
1. Construct a complete frequency distribution table of the scores
2. Construct a frequency polygon.
3. Draw an histogram of the scores.
4. Construct a pie chart.
5. Construct a Cumulative Frequency greater than less thn ogive.
Expert Solution
This question has been solved!
Explore an expertly crafted, step-by-step solution for a thorough understanding of key concepts.

Step by step
Solved in 4 steps with 5 images

Recommended textbooks for you
Glencoe Algebra 1, Student Edition, 9780079039897…
Algebra
ISBN:
9780079039897
Author:
Carter
Publisher:
McGraw Hill
Glencoe Algebra 1, Student Edition, 9780079039897…
Algebra
ISBN:
9780079039897
Author:
Carter
Publisher:
McGraw Hill