Nine experts rated two brands of coffee in a taste-testing experiment. A rating on a 7-point scale (1= extremely unpleasing, 7 = extremely pleasing) is given for each of four characteristics: taste, aroma, richness, and acidity. The accompanying data table contains the ratings accumulated over all four characteristics. Complete parts (a) through (d) below. Click the icon to view the data table. - P1 P27 H₁: HD > 0 טון - OC. Ho: HD *0 (where #p=₁-1₂) H₁: HD=0 The test statistic is ISTAT = -3.05. (Type an integer or a decimal. Round to two decimal places as needed.) A. It must be assumed that the distribution of the differences between the measurements is approximately normal. OB. It must be assumed that the distribution of the differences between the measurements is approximately uniform. OC. It must be assumed that the distribution of the differences between the measurements is skewed. ⒸD P1 P27 H₁: HD *0 The critical value(s) is(are) -1.86,1.86 (Type integers or decimals. Round to two decimal places as needed. Use a comma to separate answers as needed.) Since the test statistic does not fall between the critical value(s), reject Ho. There is sufficient evidence to conclude that the mean ratings are different between the two brands. b. What assumption is necessary about the population distribution in order to perform this test? c. Determine the p-value in (a) and interpret its meaning. The test statistic gives a p-value of 0.016. (Type an integer or a decimal. Round to three decimal places as needed.) Interpret the meaning of the p-value in (a). Choose the correct answer below. OD. Ho: Hp 20 (where Hp ₁-₂) H₁: HD <0 OA. The p-value is the probability of obtaining a sample mean difference less extreme than this one if the population mean ratings for the two brands are the same. OB. The p-value is the probability of failing to reject the null hypothesis when it is actually false. C. The p-value is the probability of obtaining a sample mean difference at least as extreme as this one if the population mean ratings for the two brands are the same. Data table Expert C.C. S.E. E.G B.I. C.M. C.N. G.N. R.M. P.V Brand A 23 26 17 d. Construct a 90% confidence interval estimate of the difference in the mean ratings between the two brands. Recall that Hp=₁-2, where ₁ is the mean rating for brand A and μ₂ is the mean rating for brand B. The 90% confidence interval estimate is (Type integers or decimals. Round to two decimal places as needed.) 2722222 23 21 24 25 23 [0 Print Brand B 25 26 19 26 22 25 24 24 23 O Done X
Nine experts rated two brands of coffee in a taste-testing experiment. A rating on a 7-point scale (1= extremely unpleasing, 7 = extremely pleasing) is given for each of four characteristics: taste, aroma, richness, and acidity. The accompanying data table contains the ratings accumulated over all four characteristics. Complete parts (a) through (d) below. Click the icon to view the data table. - P1 P27 H₁: HD > 0 טון - OC. Ho: HD *0 (where #p=₁-1₂) H₁: HD=0 The test statistic is ISTAT = -3.05. (Type an integer or a decimal. Round to two decimal places as needed.) A. It must be assumed that the distribution of the differences between the measurements is approximately normal. OB. It must be assumed that the distribution of the differences between the measurements is approximately uniform. OC. It must be assumed that the distribution of the differences between the measurements is skewed. ⒸD P1 P27 H₁: HD *0 The critical value(s) is(are) -1.86,1.86 (Type integers or decimals. Round to two decimal places as needed. Use a comma to separate answers as needed.) Since the test statistic does not fall between the critical value(s), reject Ho. There is sufficient evidence to conclude that the mean ratings are different between the two brands. b. What assumption is necessary about the population distribution in order to perform this test? c. Determine the p-value in (a) and interpret its meaning. The test statistic gives a p-value of 0.016. (Type an integer or a decimal. Round to three decimal places as needed.) Interpret the meaning of the p-value in (a). Choose the correct answer below. OD. Ho: Hp 20 (where Hp ₁-₂) H₁: HD <0 OA. The p-value is the probability of obtaining a sample mean difference less extreme than this one if the population mean ratings for the two brands are the same. OB. The p-value is the probability of failing to reject the null hypothesis when it is actually false. C. The p-value is the probability of obtaining a sample mean difference at least as extreme as this one if the population mean ratings for the two brands are the same. Data table Expert C.C. S.E. E.G B.I. C.M. C.N. G.N. R.M. P.V Brand A 23 26 17 d. Construct a 90% confidence interval estimate of the difference in the mean ratings between the two brands. Recall that Hp=₁-2, where ₁ is the mean rating for brand A and μ₂ is the mean rating for brand B. The 90% confidence interval estimate is (Type integers or decimals. Round to two decimal places as needed.) 2722222 23 21 24 25 23 [0 Print Brand B 25 26 19 26 22 25 24 24 23 O Done X

Glencoe Algebra 1, Student Edition, 9780079039897, 0079039898, 2018
18th Edition
ISBN:9780079039897
Author:Carter
Publisher:Carter
Chapter10: Statistics
Section10.6: Summarizing Categorical Data
Problem 25PPS

Related questions
Question
100%
Answer D
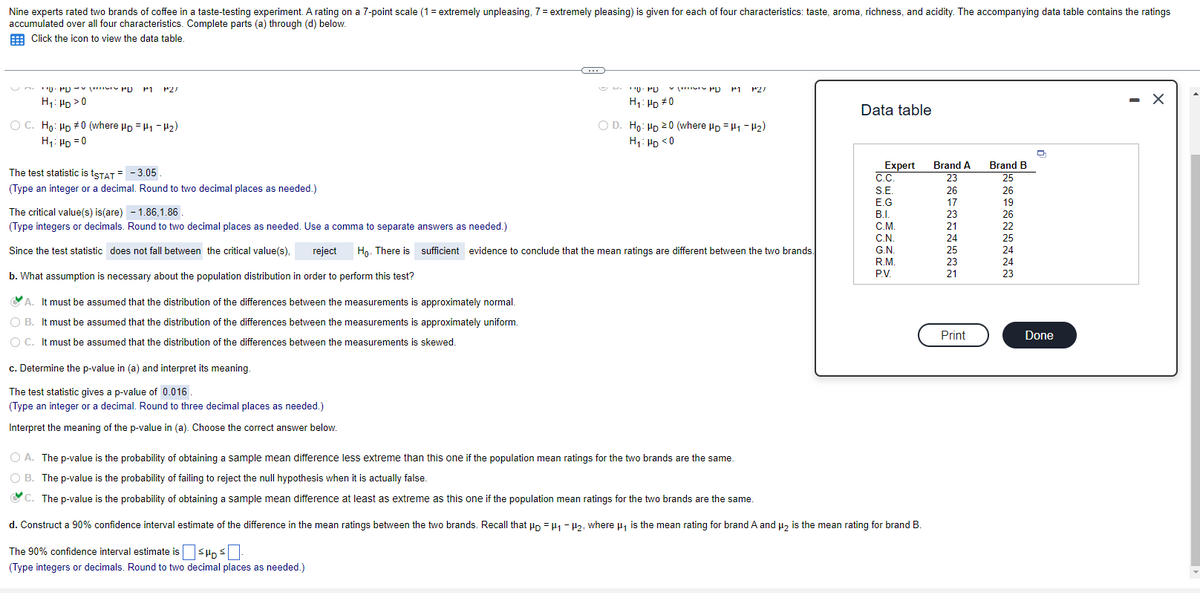
Transcribed Image Text:Nine experts rated two brands of coffee in a taste-testing experiment. A rating on a 7-point scale (1 = extremely unpleasing, 7 = extremely pleasing) is given for each of four characteristics: taste, aroma, richness, and acidity. The accompanying data table contains the ratings
accumulated over all four characteristics. Complete parts (a) through (d) below.
Click the icon to view the data table.
OPD
H₁: HD > 0
M1 P27
OC. Ho: HD #0 (where HD H1-H₂)
H₁: HD=0
The test statistic is tSTAT = -3.05.
(Type an integer or a decimal. Round to two decimal places as needed.)
The critical value(s) is (are) -1.86,1.86.
(Type integers or decimals. Round to two decimal places as needed. Use a comma to separate answers as needed.)
Since the test statistic does not fall between the critical value(s), reject Ho. There is
b. What assumption is necessary about the population distribution in order to perform this test?
A. It must be assumed that the distribution of the differences between the measurements is approximately normal.
O B. It must be assumed that the distribution of the differences between the measurements is approximately uniform.
O C. It must be assumed that the distribution of the differences between the measurements is skewed.
c. Determine the p-value in (a) and interpret its meaning.
The test statistic gives a p-value of 0.016
(Type an integer or a decimal. Round to three decimal places as needed.)
Interpret the meaning of the p-value in (a). Choose the correct answer below.
G
¹0. PD
H₁: HD #0
PD
M1
P27
O D. Ho: HD 20 (where HD H₁-H₂)
H₁: HD <0
sufficient evidence to conclude that the mean ratings are different between the two brands.
Data table
Expert
C.C.
S.E.
E.G
B.I.
C.M.
C.N.
G.N.
R.M.
P.V.
O A. The p-value is the probability of obtaining a sample mean difference less extreme than this one if the population mean ratings for the two brands are the same.
O B. The p-value is the probability of failing to reject the null hypothesis when it is actually false.
C. The p-value is the probability of obtaining a sample mean difference at least as extreme as this one if the population mean ratings for the two brands are the same.
d. Construct a 90% confidence interval estimate of the difference in the mean ratings between the two brands. Recall that Hp H₁-H₂, where is the mean rating for brand A and μ₂ is the mean rating for brand B.
The 90% confidence interval estimate is HD ³.
(Type integers or decimals. Round to two decimal places as needed.)
Brand A
23
26
17
23
21
24
25
23
21
Print
Brand B
GHEDENHE
25
26
19
26
22
25
24
24
23
D
Done
X
Expert Solution
This question has been solved!
Explore an expertly crafted, step-by-step solution for a thorough understanding of key concepts.

Step by step
Solved in 4 steps with 14 images

Recommended textbooks for you
Glencoe Algebra 1, Student Edition, 9780079039897…
Algebra
ISBN:
9780079039897
Author:
Carter
Publisher:
McGraw Hill

Holt Mcdougal Larson Pre-algebra: Student Edition…
Algebra
ISBN:
9780547587776
Author:
HOLT MCDOUGAL
Publisher:
HOLT MCDOUGAL

Big Ideas Math A Bridge To Success Algebra 1: Stu…
Algebra
ISBN:
9781680331141
Author:
HOUGHTON MIFFLIN HARCOURT
Publisher:
Houghton Mifflin Harcourt
Glencoe Algebra 1, Student Edition, 9780079039897…
Algebra
ISBN:
9780079039897
Author:
Carter
Publisher:
McGraw Hill
Holt Mcdougal Larson Pre-algebra: Student Edition…
Algebra
ISBN:
9780547587776
Author:
HOLT MCDOUGAL
Publisher:
HOLT MCDOUGAL
Big Ideas Math A Bridge To Success Algebra 1: Stu…
Algebra
ISBN:
9781680331141
Author:
HOUGHTON MIFFLIN HARCOURT
Publisher:
Houghton Mifflin Harcourt