No Runner Music 535 531 528 524 433 496 555 399 537 542 521 Music 468 449 482 571 562 592 471 499 552 500 524 1 2 3 5 6 7 8 10 11 Do the data provide convincing evidence that the mean time to exhaustion for experienced triathletes is greater when they run while listening to motivational music? Test the relevant hypotheses using a significance level of 0.1. 1. First, which test are you proceeding with? One-sample Z-test, One-sample t-test, Matched pairs t-test, Two sample t-test, and why that test? 2. Find the sample mean(s), and sample standard deviation(s). 3. State your hypotheses in terms of [music] minus [no music], find the test statistic, find the P-value, and interpret your result.
No Runner Music 535 531 528 524 433 496 555 399 537 542 521 Music 468 449 482 571 562 592 471 499 552 500 524 1 2 3 5 6 7 8 10 11 Do the data provide convincing evidence that the mean time to exhaustion for experienced triathletes is greater when they run while listening to motivational music? Test the relevant hypotheses using a significance level of 0.1. 1. First, which test are you proceeding with? One-sample Z-test, One-sample t-test, Matched pairs t-test, Two sample t-test, and why that test? 2. Find the sample mean(s), and sample standard deviation(s). 3. State your hypotheses in terms of [music] minus [no music], find the test statistic, find the P-value, and interpret your result.

Glencoe Algebra 1, Student Edition, 9780079039897, 0079039898, 2018
18th Edition
ISBN:9780079039897
Author:Carter
Publisher:Carter
Chapter10: Statistics
Section10.5: Comparing Sets Of Data
Problem 3BGP

Related questions
Question
![No
Runner Music
Music
535
531
528
524
433
496
468
449
482
571
1
3
4
562
592
471
499
552
500
524
7
555
399
537
542
521
10
11
Do the data provide convincing evidence that the mean
time to exhaustion for experienced triathletes is
greater when they run while listening to motivational
music? Test the relevant hypotheses using a
significance level of 0.1.
1. First, which test are you proceeding with?
One-sample Z-test, One-sample t-test,
Matched pairs t-test, Two sample t-test, and
why that test?
2. Find the sample mean(s), and sample
standard deviation(s).
3. State your hypotheses in terms of [music]
minus [no music], find the test statistic, find
the P-value, and interpret your result.](/v2/_next/image?url=https%3A%2F%2Fcontent.bartleby.com%2Fqna-images%2Fquestion%2F36e2a10a-56c0-4adb-bccf-fb7de3247667%2Fdbce0ac4-6047-4865-819d-5eea663b516e%2Fxrsi68v_processed.jpeg&w=3840&q=75)
Transcribed Image Text:No
Runner Music
Music
535
531
528
524
433
496
468
449
482
571
1
3
4
562
592
471
499
552
500
524
7
555
399
537
542
521
10
11
Do the data provide convincing evidence that the mean
time to exhaustion for experienced triathletes is
greater when they run while listening to motivational
music? Test the relevant hypotheses using a
significance level of 0.1.
1. First, which test are you proceeding with?
One-sample Z-test, One-sample t-test,
Matched pairs t-test, Two sample t-test, and
why that test?
2. Find the sample mean(s), and sample
standard deviation(s).
3. State your hypotheses in terms of [music]
minus [no music], find the test statistic, find
the P-value, and interpret your result.
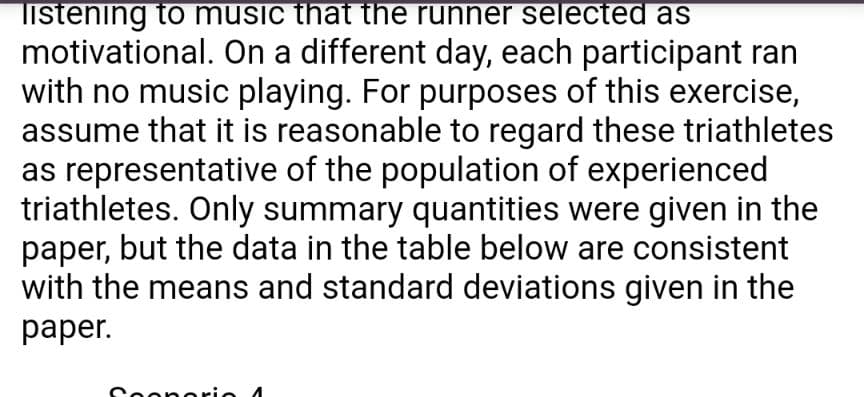
Transcribed Image Text:listening to music that the runner selected as
motivational. On a different day, each participant ran
with no music playing. For purposes of this exercise,
assume that it is reasonable to regard these triathletes
as representative of the population of experienced
triathletes. Only summary quantities were given in the
paper, but the data in the table below are consistent
with the means and standard deviations given in the
раper.
Coonorio 4
Expert Solution
This question has been solved!
Explore an expertly crafted, step-by-step solution for a thorough understanding of key concepts.

This is a popular solution!

Trending now
This is a popular solution!

Step by step
Solved in 4 steps with 2 images

Recommended textbooks for you
Glencoe Algebra 1, Student Edition, 9780079039897…
Algebra
ISBN:
9780079039897
Author:
Carter
Publisher:
McGraw Hill
Glencoe Algebra 1, Student Edition, 9780079039897…
Algebra
ISBN:
9780079039897
Author:
Carter
Publisher:
McGraw Hill