Nobility Homes, Incorporated, is a small maker of manufactured homes sold throughout the state of Flor financial data for the company for the period 2012-2016. Profit margin (%) Retention ratio (%) Asset turnover (X) Financial leverage (X) Growth rate in sales (%) 2012 Year 2012 2013 2014 0.4 100.0 0.36 1.01 16.6 Sustainable Growth Rate % % % 2013 Source: Data from Nobility Homes 2012 to 2016 annual reports 5.0 100.0 0.41 1.05 16.1 2014 4.6 100.0 0.46 1.08 13.6 2015 8.6 100.0 0.51 1.13 30.1 2016 a. Calculate Nobility Homes' annual sustainable growth rate for the years 2012 through 2016. Note: Round your answers to 1 decimal place. 16.6 100.0 0.56 1.21 21.6
Nobility Homes, Incorporated, is a small maker of manufactured homes sold throughout the state of Flor financial data for the company for the period 2012-2016. Profit margin (%) Retention ratio (%) Asset turnover (X) Financial leverage (X) Growth rate in sales (%) 2012 Year 2012 2013 2014 0.4 100.0 0.36 1.01 16.6 Sustainable Growth Rate % % % 2013 Source: Data from Nobility Homes 2012 to 2016 annual reports 5.0 100.0 0.41 1.05 16.1 2014 4.6 100.0 0.46 1.08 13.6 2015 8.6 100.0 0.51 1.13 30.1 2016 a. Calculate Nobility Homes' annual sustainable growth rate for the years 2012 through 2016. Note: Round your answers to 1 decimal place. 16.6 100.0 0.56 1.21 21.6

Chapter5: Evaluating Operating And Financial Performance
Section: Chapter Questions
Problem 1EP

Related questions

Concept explainers
Financial Ratios
A Ratio refers to a figure calculated as a reference to the relationship of two or more numbers and can be expressed as a fraction, proportion, percentage, or the number of times. When the number is determined by taking two accounting numbers derived from the financial statements, it is termed as the accounting ratio.
Return on Equity
The Return on Equity (RoE) is a measure of the profitability of a business concerning the funds by its stockholders/shareholders. ROE is a metric used generally to determine how well the company utilizes its funds provided by the equity shareholders.
Topic Video
Question
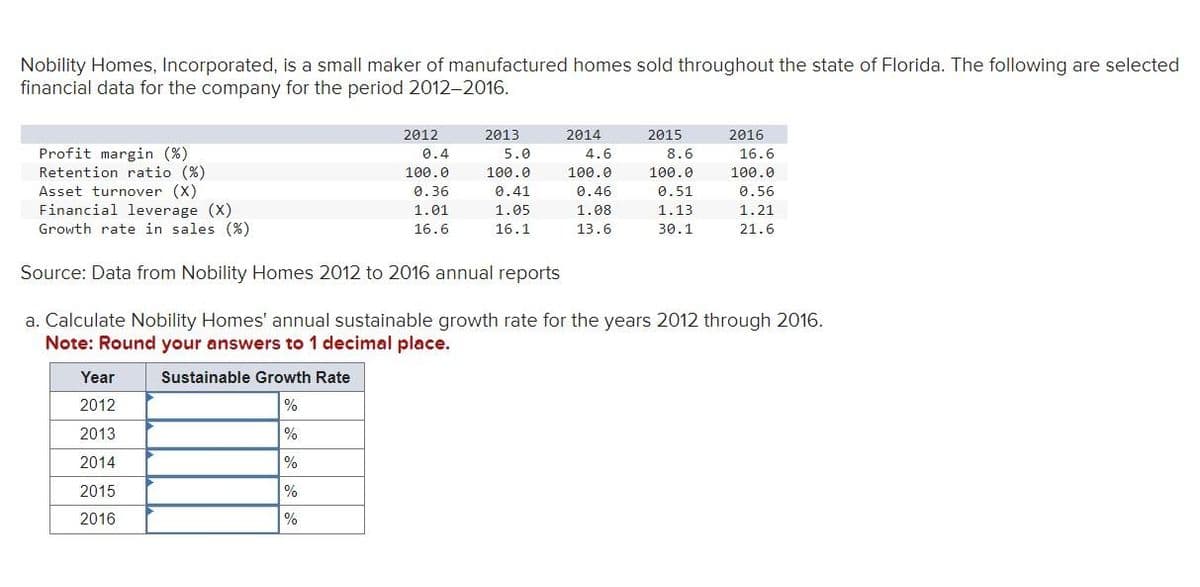
Transcribed Image Text:Nobility Homes, Incorporated, is a small maker of manufactured homes sold throughout the state of Florida. The following are selected
financial data for the company for the period 2012-2016.
Profit margin (%)
Retention ratio (%)
Asset turnover (X)
Financial leverage (X)
Growth rate in sales (%)
Year
2012
2013
2014
2015
2016
2012
0.4
100.0
0.36
1.01
16.6
Sustainable Growth Rate
%
%
%
%
%
2013
5.0
100.0
0.41
1.05
16.1
2014
4.6
100.0
0.46
1.08
13.6
2015
8.6
100.0
0.51
1.13
30.1
2016
Source: Data from Nobility Homes 2012 to 2016 annual reports
a. Calculate Nobility Homes' annual sustainable growth rate for the years 2012 through 2016.
Note: Round your answers to 1 decimal place.
16.6
100.0
0.56
1.21
21.6
Expert Solution
This question has been solved!
Explore an expertly crafted, step-by-step solution for a thorough understanding of key concepts.

This is a popular solution!

Trending now
This is a popular solution!

Step by step
Solved in 2 steps

Knowledge Booster


Learn more about
Need a deep-dive on the concept behind this application? Look no further. Learn more about this topic, finance and related others by exploring similar questions and additional content below.Recommended textbooks for you