nonsufferers, respectively. Assume that the two distributions of heat output are normal with a- 0.1 and a2 - 0.5. (a) Consider testing Ho: H1 -H 2 --1.0 versus Hai H1-H is the same as that of non-sufferers. Ha says that the average heat output for sufferers is more than 1 cal/cm/min below that of non-sufferers. Ha says that the average heat output for sufferers is less than 1 cal/cm/min below that of non-sufferers. Calculate the test statistic and P-value. (Round your test statistic to two decimal places and your P-value to four decimal places.) P-value= State the conclusion in the problem context. Fail to reject Ho. The data suggests that the average heat output for sufferers is the same as that of non-sufferers. Fail to reject Ho. The data suggests that the average heat output for sufferers is less than 1 cal/cm/min below that of non-sufferers. Reject Ho. The data suggests that the average heat output for sufferers is more than 1 cal/cm/min below that of non-sufferers. Reject Ho. The data suggests that the average heat output for sufferers is the same as that non-sufferers. (b) What is the probability of a type II error when the actual difference between and 2 is H1 - H2 = -1.1? (Round your answer to four decimal places.) (c) Assuming that m-n, what sample sizes are required to ensure that - 0.1 when - 2- -1.1? (Round your answer up to the nearest whole number.) subjects
nonsufferers, respectively. Assume that the two distributions of heat output are normal with a- 0.1 and a2 - 0.5. (a) Consider testing Ho: H1 -H 2 --1.0 versus Hai H1-H is the same as that of non-sufferers. Ha says that the average heat output for sufferers is more than 1 cal/cm/min below that of non-sufferers. Ha says that the average heat output for sufferers is less than 1 cal/cm/min below that of non-sufferers. Calculate the test statistic and P-value. (Round your test statistic to two decimal places and your P-value to four decimal places.) P-value= State the conclusion in the problem context. Fail to reject Ho. The data suggests that the average heat output for sufferers is the same as that of non-sufferers. Fail to reject Ho. The data suggests that the average heat output for sufferers is less than 1 cal/cm/min below that of non-sufferers. Reject Ho. The data suggests that the average heat output for sufferers is more than 1 cal/cm/min below that of non-sufferers. Reject Ho. The data suggests that the average heat output for sufferers is the same as that non-sufferers. (b) What is the probability of a type II error when the actual difference between and 2 is H1 - H2 = -1.1? (Round your answer to four decimal places.) (c) Assuming that m-n, what sample sizes are required to ensure that - 0.1 when - 2- -1.1? (Round your answer up to the nearest whole number.) subjects

Algebra: Structure And Method, Book 1
(REV)00th Edition
ISBN:9780395977224
Author:Richard G. Brown, Mary P. Dolciani, Robert H. Sorgenfrey, William L. Cole
Publisher:Richard G. Brown, Mary P. Dolciani, Robert H. Sorgenfrey, William L. Cole
Chapter12: Quadratic Functions
Section12.6: Solving Problems Involving Quadratic Equations
Problem 1.3E

Related questions
Question
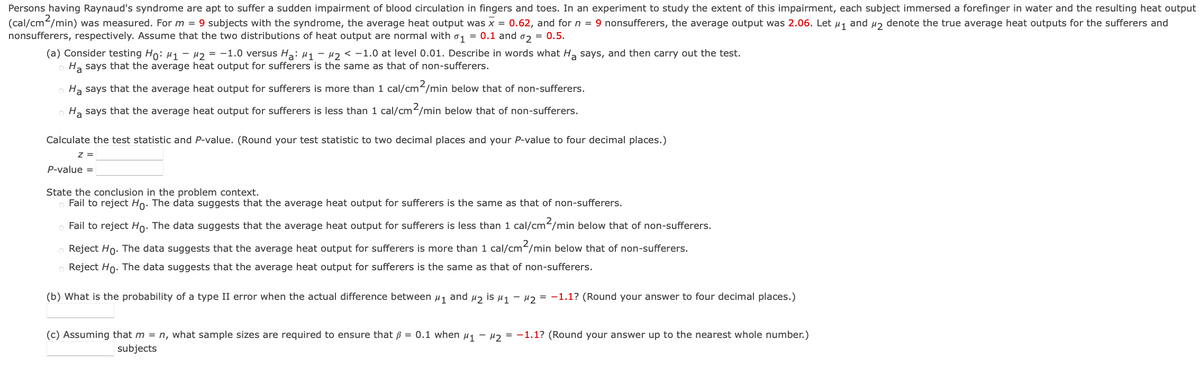
Transcribed Image Text:Persons having Raynaud's syndrome are apt to suffer a sudden impairment of blood circulation in fingers and toes. In an experiment to study the extent of this impairment, each subject immersed a forefinger in water and the resulting heat output
(cal/cm/min) was measured. For m = 9 subjects with the syndrome, the average heat output was x = 0.62, and for n = 9 nonsufferers, the average output was 2.06. Let µj and µɔ denote the true average heat outputs for the sufferers and
nonsufferers, respectively. Assume that the two distributions of heat output are normal with o1 = 0.1 and o2 = 0.5.
(a) Consider testing Ho: H1 - H2 = -1.0 versus Ha: µ1 - H2 < -1.0 at level 0.01. Describe in words what H, says, and then carry out the test.
Ha says that the average heat output for sufferers is the same as that of non-sufferers.
O Ha says that the average heat output for sufferers is more than 1 cal/cm/min below that of non-sufferers.
O H, says that the average heat output for sufferers is less than 1 cal/cm2/min below that of non-sufferers.
Calculate the test statistic and P-value. (Round your test statistic to two decimal places and your P-value to four decimal places.)
z =
P-value =
State the conclusion in the problem context.
Fail to reject Ho: The data suggests that the average heat output for sufferers is the same as that of non-sufferers.
o Fail to reject Họ. The data suggests that the average heat output for sufferers is less than 1 cal/cm/min below that of non-sufferers.
o Reject Ho. The data suggests that the average heat output for sufferers is more than 1 cal/cm/min below that of non-sufferers.
Reject Ho. The data suggests that the average heat output for sufferers is the same as that of non-sufferers.
(b) What is the probability of a type II error when the actual difference between uj and uz is µ1 - H2 = -1.1? (Round your answer to four decimal places.)
(c) Assuming that m = n, what sample sizes are required to ensure that ß = 0.1 when u1
H2 = -1.1? (Round your answer up to the nearest whole number.)
subjects
Expert Solution
This question has been solved!
Explore an expertly crafted, step-by-step solution for a thorough understanding of key concepts.

This is a popular solution!

Trending now
This is a popular solution!

Step by step
Solved in 3 steps with 3 images

Recommended textbooks for you
Algebra: Structure And Method, Book 1
Algebra
ISBN:
9780395977224
Author:
Richard G. Brown, Mary P. Dolciani, Robert H. Sorgenfrey, William L. Cole
Publisher:
McDougal Littell
Algebra: Structure And Method, Book 1
Algebra
ISBN:
9780395977224
Author:
Richard G. Brown, Mary P. Dolciani, Robert H. Sorgenfrey, William L. Cole
Publisher:
McDougal Littell