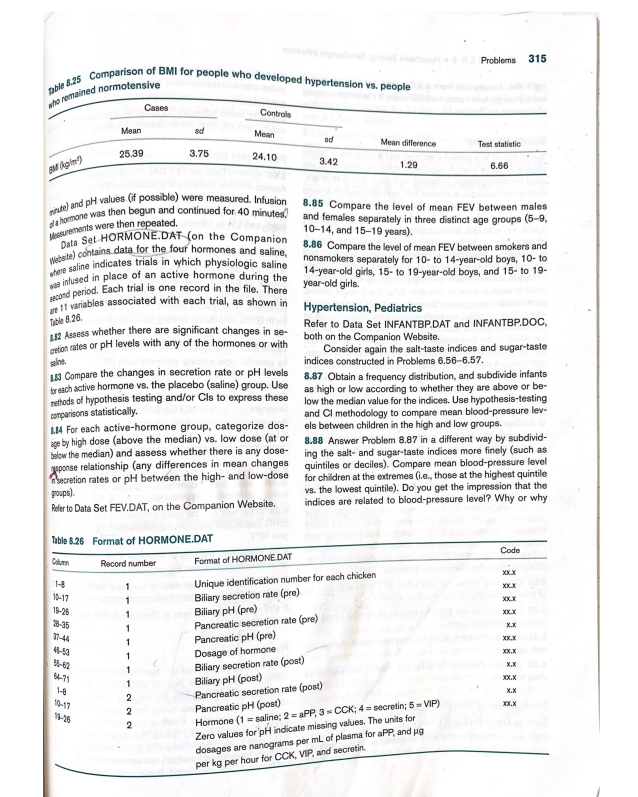
not teerlogel * 8 Problems 315 who remained normotensive Table 8.25 Comparison of BMI for people who developed hypertension vs. people BM (kpl) Cases Controls Mean sd Mean ad Mean difference Test statistic 3.75 24.10 3.42 1.29 6.66 25.39 minute) and pH values (if possible) were measured. Infusion of a hormone was then begun and continued for 40 minutes Measurements were then repeated. Data Set HORMONE.DAT (on the Companion Website) contains data for the four hormones and saline, where saline indicates trials in which physiologic saline was infused in place of an active hormone during the second period. Each trial is one record in the file. There are 11 variables associated with each trial, as shown in Table 8.26. 882 Assess whether there are significant changes in se- cretion rates or pH levels with any of the hormones or with saine. 183 Compare the changes in secretion rate or pH levels for each active hormone vs. the placebo (saline) group. Use methods of hypothesis testing and/or Cls to express these comparisons statistically. 8.84 For each active-hormone group, categorize dos- age by high dose (above the median) vs. low dose (at or below the median) and assess whether there is any dose- sponse relationship (any differences in mean changes secretion rates or pH between the high- and low-dose groups). Refer to Data Set FEV.DAT, on the Companion Website. Table 8.26 Format of HORMONE.DAT Format of HORMONE DAT 8.85 Compare the level of mean FEV between males and females separately in three distinct age groups (5-9, 10-14, and 15-19 years). 8.86 Compare the level of mean FEV between smokers and nonsmokers separately for 10- to 14-year-old boys, 10-to 14-year-old girls, 15- to 19-year-old boys, and 15- to 19- year-old girls. Hypertension, Pediatrics Refer to Data Set INFANTBP.DAT and INFANTBP.DOC, both on the Companion Website. Consider again the salt-taste indices and sugar-taste indices constructed in Problems 6.56-6.57. 8.87 Obtain a frequency distribution, and subdivide infants as high or low according to whether they are above or be- low the median value for the indices. Use hypothesis-testing and Cl methodology to compare mean blood-pressure lev- els between children in the high and low groups. 8.88 Answer Problem 8.87 in a different way by subdivid- ing the salt- and sugar-taste indices more finely (such as quintiles or deciles). Compare mean blood-pressure level for children at the extremes (i.e., those at the highest quintile vs. the lowest quintile). Do you get the impression that the indices are related to blood-pressure level? Why or why Code Column Record number 1-8 1 10-17 19-26 Biliary pH (pre) 28-35 Biliary secretion rate (pre) Pancreatic secretion rate (pre) 1 37-44 1 Pancreatic pH (pre) 48-53 Dosage of hormone 55-62 1 64-71 Biliary pH (post) Biliary secretion rate (post) 1-8 2 10-17 2 Pancreatic pH (post) Pancreatic secretion rate (post) 18-26 2 Hormone (1 saline; 2=aPP, 3=CCK; 4-secretin; 5-VIP) Zero values for pH indicate missing values. The units for dosages are nanograms per mL of plasma for aPP, and ug per kg per hour for CCK, VIP, and secretin. Unique identification number for each chicken XXX XXXX XXX XXX x.x XX.X XX.X x.x XX.X X.X XX.X FEV.DOC Variable Column Description Id 1-5 ID number Age FEV Hgt 7-8 10-15 17-20 Age (yrs) Sex 22 Smoke 24 Format or Code FEV (liters) Height (inches) Sex Smoking Status X.XXXX XX.X 0 female/1=male 0 non-current smoker/ 1 current smoker
not teerlogel * 8 Problems 315 who remained normotensive Table 8.25 Comparison of BMI for people who developed hypertension vs. people BM (kpl) Cases Controls Mean sd Mean ad Mean difference Test statistic 3.75 24.10 3.42 1.29 6.66 25.39 minute) and pH values (if possible) were measured. Infusion of a hormone was then begun and continued for 40 minutes Measurements were then repeated. Data Set HORMONE.DAT (on the Companion Website) contains data for the four hormones and saline, where saline indicates trials in which physiologic saline was infused in place of an active hormone during the second period. Each trial is one record in the file. There are 11 variables associated with each trial, as shown in Table 8.26. 882 Assess whether there are significant changes in se- cretion rates or pH levels with any of the hormones or with saine. 183 Compare the changes in secretion rate or pH levels for each active hormone vs. the placebo (saline) group. Use methods of hypothesis testing and/or Cls to express these comparisons statistically. 8.84 For each active-hormone group, categorize dos- age by high dose (above the median) vs. low dose (at or below the median) and assess whether there is any dose- sponse relationship (any differences in mean changes secretion rates or pH between the high- and low-dose groups). Refer to Data Set FEV.DAT, on the Companion Website. Table 8.26 Format of HORMONE.DAT Format of HORMONE DAT 8.85 Compare the level of mean FEV between males and females separately in three distinct age groups (5-9, 10-14, and 15-19 years). 8.86 Compare the level of mean FEV between smokers and nonsmokers separately for 10- to 14-year-old boys, 10-to 14-year-old girls, 15- to 19-year-old boys, and 15- to 19- year-old girls. Hypertension, Pediatrics Refer to Data Set INFANTBP.DAT and INFANTBP.DOC, both on the Companion Website. Consider again the salt-taste indices and sugar-taste indices constructed in Problems 6.56-6.57. 8.87 Obtain a frequency distribution, and subdivide infants as high or low according to whether they are above or be- low the median value for the indices. Use hypothesis-testing and Cl methodology to compare mean blood-pressure lev- els between children in the high and low groups. 8.88 Answer Problem 8.87 in a different way by subdivid- ing the salt- and sugar-taste indices more finely (such as quintiles or deciles). Compare mean blood-pressure level for children at the extremes (i.e., those at the highest quintile vs. the lowest quintile). Do you get the impression that the indices are related to blood-pressure level? Why or why Code Column Record number 1-8 1 10-17 19-26 Biliary pH (pre) 28-35 Biliary secretion rate (pre) Pancreatic secretion rate (pre) 1 37-44 1 Pancreatic pH (pre) 48-53 Dosage of hormone 55-62 1 64-71 Biliary pH (post) Biliary secretion rate (post) 1-8 2 10-17 2 Pancreatic pH (post) Pancreatic secretion rate (post) 18-26 2 Hormone (1 saline; 2=aPP, 3=CCK; 4-secretin; 5-VIP) Zero values for pH indicate missing values. The units for dosages are nanograms per mL of plasma for aPP, and ug per kg per hour for CCK, VIP, and secretin. Unique identification number for each chicken XXX XXXX XXX XXX x.x XX.X XX.X x.x XX.X X.X XX.X FEV.DOC Variable Column Description Id 1-5 ID number Age FEV Hgt 7-8 10-15 17-20 Age (yrs) Sex 22 Smoke 24 Format or Code FEV (liters) Height (inches) Sex Smoking Status X.XXXX XX.X 0 female/1=male 0 non-current smoker/ 1 current smoker

Glencoe Algebra 1, Student Edition, 9780079039897, 0079039898, 2018
18th Edition
ISBN:9780079039897
Author:Carter
Publisher:Carter
Chapter10: Statistics
Section: Chapter Questions
Problem 25SGR

Related questions
Question
Please solve 8.85 and 8.86 using R
Transcribed Image Text:not teerlogel * 8 Problems
315
who remained normotensive
Table 8.25 Comparison of BMI for people who developed hypertension vs. people
BM (kpl)
Cases
Controls
Mean
sd
Mean
ad
Mean difference
Test statistic
3.75
24.10
3.42
1.29
6.66
25.39
minute) and pH values (if possible) were measured. Infusion
of a hormone was then begun and continued for 40 minutes
Measurements were then repeated.
Data Set HORMONE.DAT (on the Companion
Website) contains data for the four hormones and saline,
where saline indicates trials in which physiologic saline
was infused in place of an active hormone during the
second period. Each trial is one record in the file. There
are 11 variables associated with each trial, as shown in
Table 8.26.
882 Assess whether there are significant changes in se-
cretion rates or pH levels with any of the hormones or with
saine.
183 Compare the changes in secretion rate or pH levels
for each active hormone vs. the placebo (saline) group. Use
methods of hypothesis testing and/or Cls to express these
comparisons statistically.
8.84 For each active-hormone group, categorize dos-
age by high dose (above the median) vs. low dose (at or
below the median) and assess whether there is any dose-
sponse relationship (any differences in mean changes
secretion rates or pH between the high- and low-dose
groups).
Refer to Data Set FEV.DAT, on the Companion Website.
Table 8.26 Format of HORMONE.DAT
Format of HORMONE DAT
8.85 Compare the level of mean FEV between males
and females separately in three distinct age groups (5-9,
10-14, and 15-19 years).
8.86 Compare the level of mean FEV between smokers and
nonsmokers separately for 10- to 14-year-old boys, 10-to
14-year-old girls, 15- to 19-year-old boys, and 15- to 19-
year-old girls.
Hypertension, Pediatrics
Refer to Data Set INFANTBP.DAT and INFANTBP.DOC,
both on the Companion Website.
Consider again the salt-taste indices and sugar-taste
indices constructed in Problems 6.56-6.57.
8.87 Obtain a frequency distribution, and subdivide infants
as high or low according to whether they are above or be-
low the median value for the indices. Use hypothesis-testing
and Cl methodology to compare mean blood-pressure lev-
els between children in the high and low groups.
8.88 Answer Problem 8.87 in a different way by subdivid-
ing the salt- and sugar-taste indices more finely (such as
quintiles or deciles). Compare mean blood-pressure level
for children at the extremes (i.e., those at the highest quintile
vs. the lowest quintile). Do you get the impression that the
indices are related to blood-pressure level? Why or why
Code
Column
Record number
1-8
1
10-17
19-26
Biliary pH (pre)
28-35
Biliary secretion rate (pre)
Pancreatic secretion rate (pre)
1
37-44
1
Pancreatic pH (pre)
48-53
Dosage of hormone
55-62
1
64-71
Biliary pH (post)
Biliary secretion rate (post)
1-8
2
10-17
2
Pancreatic pH (post)
Pancreatic secretion rate (post)
18-26
2
Hormone (1 saline; 2=aPP, 3=CCK; 4-secretin; 5-VIP)
Zero values for pH indicate missing values. The units for
dosages are nanograms per mL of plasma for aPP, and ug
per kg per hour for CCK, VIP, and secretin.
Unique identification number for each chicken
XXX
XXXX
XXX
XXX
x.x
XX.X
XX.X
x.x
XX.X
X.X
XX.X
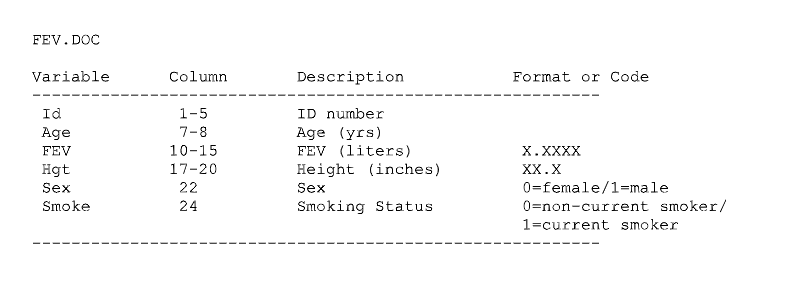
Transcribed Image Text:FEV.DOC
Variable
Column
Description
Id
1-5
ID number
Age
FEV
Hgt
7-8
10-15
17-20
Age (yrs)
Sex
22
Smoke
24
Format or Code
FEV (liters)
Height (inches)
Sex
Smoking Status
X.XXXX
XX.X
0 female/1=male
0 non-current smoker/
1 current smoker
Expert Solution
This question has been solved!
Explore an expertly crafted, step-by-step solution for a thorough understanding of key concepts.

This is a popular solution!

Trending now
This is a popular solution!

Step by step
Solved in 1 steps

Recommended textbooks for you
Glencoe Algebra 1, Student Edition, 9780079039897…
Algebra
ISBN:
9780079039897
Author:
Carter
Publisher:
McGraw Hill
Glencoe Algebra 1, Student Edition, 9780079039897…
Algebra
ISBN:
9780079039897
Author:
Carter
Publisher:
McGraw Hill