number of drinks per week 3 8 2 15 2 2 0 0 4 5 2

Glencoe Algebra 1, Student Edition, 9780079039897, 0079039898, 2018
18th Edition
ISBN:9780079039897
Author:Carter
Publisher:Carter
Chapter10: Statistics
Section10.4: Distributions Of Data
Problem 19PFA

Related questions
Question
100%
number of drinks per week
3
8
2
15
2
2
0
0
4
5
2
7
0
1
5
3
0
2
5
4
1
6
9
5
3
1
2
10
6
1
1
2
1
19
6
6
6
7
0
4
1
1
1
0
1
9
2
2
2
1
16
10
10
5
2
3
1
4
4
4
3
6
2
8
5
2
7
1
6
4
0
3
1
1
1
3
8
2
15
2
2
0
0
4
5
2
7
0
1
5
3
0
2
5
4
1
6
9
5
3
1
2
10
6
1
1
2
1
19
6
6
6
7
0
4
1
1
1
0
1
9
2
2
2
1
16
10
10
5
2
3
1
4
4
4
3
6
2
8
5
2
7
1
6
4
0
3
1
1
1
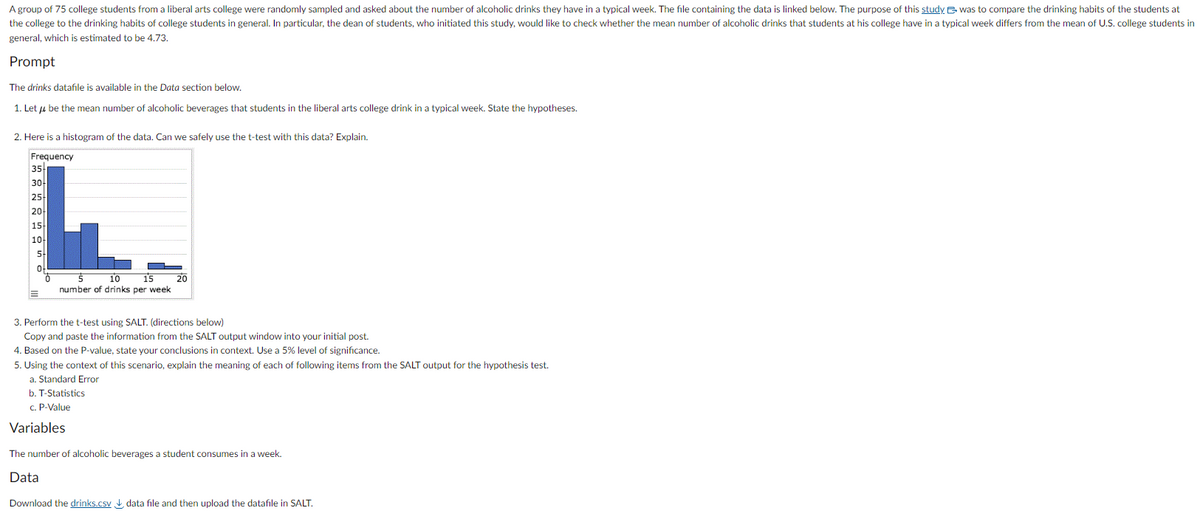
Transcribed Image Text:A group of 75 college students from a liberal arts college were randomly sampled and asked about the number of alcoholic drinks they have in a typical week. The file containing the data is linked below. The purpose of this study was to compare the drinking habits of the students at
the college to the drinking habits of college students in general. In particular, the dean of students, who initiated this study, would like to check whether the mean number of alcoholic drinks that students at his college have in a typical week differs from the mean of U.S. college students in
general, which is estimated to be 4.73.
Prompt
The drinks datafile is available in the Data section below.
1. Let be the mean number of alcoholic beverages that students in the liberal arts college drink in a typical week. State the hypotheses.
2. Here is a histogram of the data. Can we safely use the t-test with this data? Explain.
Frequency
35
30+
25
20
15
10
5+
of
0
E
5
number of drinks per week
10 15 20
3. Perform the t-test using SALT. (directions below)
Copy and paste the information from the SALT output window into your initial post.
4. Based on the P-value, state your conclusions in context. Use a 5% level of significance.
5. Using the context of this scenario, explain the meaning of each of following items from the SALT output for the hypothesis test.
a. Standard Error
b. T-Statistics
c. P-Value
Variables
The number of alcoholic beverages a student consumes in a week.
Data
Download the drinks.csv data file and then upload the datafile in SALT.
Expert Solution
This question has been solved!
Explore an expertly crafted, step-by-step solution for a thorough understanding of key concepts.

Step by step
Solved in 4 steps with 3 images

Recommended textbooks for you
Glencoe Algebra 1, Student Edition, 9780079039897…
Algebra
ISBN:
9780079039897
Author:
Carter
Publisher:
McGraw Hill

Holt Mcdougal Larson Pre-algebra: Student Edition…
Algebra
ISBN:
9780547587776
Author:
HOLT MCDOUGAL
Publisher:
HOLT MCDOUGAL
Glencoe Algebra 1, Student Edition, 9780079039897…
Algebra
ISBN:
9780079039897
Author:
Carter
Publisher:
McGraw Hill
Holt Mcdougal Larson Pre-algebra: Student Edition…
Algebra
ISBN:
9780547587776
Author:
HOLT MCDOUGAL
Publisher:
HOLT MCDOUGAL