Number of medals 1. Number of scouts 1-2 3-5 7 8-11 12-15 16-20 21-30 10 16 42 12 10 40 48 12 10 Consider the histogram for the above distribution of the number of medals for the scouts in a certain Boy Scout Council. Be careful. The number 42, for example, is the number of scouts with 3-5 medals. It is not the percentage of the population with 3-5 medals. (a) Draw the histogram, as defined in our text. (b) i. The units on the horizontal scale are: (A) number of medals (B) number of scouts (C) % of scouts (D) aгea ii. The vertical scale is a scale. (C) density (A) measurement iii. The area of the block for 8 to 11 medals (inclusive) represents: (A) number of medals iv. The area of the block for 8 to 11 medals (inclusive) is: (A) 40% (B) 20 scouts (C) 20 medals (D) 20% (E) 5% per medal (F) 5% per scout v. The height of the block for 21-30 medals is: (A) 5% (B) 5% per medal (C) 1/2% per medal (D) 5/9% per medal (E) 10 medals vi. The endpoints of the base of the block for 1 or 2 medals are: (A) 1 and 2 (B) 1.5 and 2.5 (C) 0 and 3 (D) 0.5 and 2.5 (E) 1 and 3 (F) 0 and 2 (B) percent (D) propensity (E) counting (B) percent of scouts (C) percent of scouts per medal vii. Which block is the most dense? (A) 1-2 (B) 3-5 (C) 8-11 (D) 12-15
Number of medals 1. Number of scouts 1-2 3-5 7 8-11 12-15 16-20 21-30 10 16 42 12 10 40 48 12 10 Consider the histogram for the above distribution of the number of medals for the scouts in a certain Boy Scout Council. Be careful. The number 42, for example, is the number of scouts with 3-5 medals. It is not the percentage of the population with 3-5 medals. (a) Draw the histogram, as defined in our text. (b) i. The units on the horizontal scale are: (A) number of medals (B) number of scouts (C) % of scouts (D) aгea ii. The vertical scale is a scale. (C) density (A) measurement iii. The area of the block for 8 to 11 medals (inclusive) represents: (A) number of medals iv. The area of the block for 8 to 11 medals (inclusive) is: (A) 40% (B) 20 scouts (C) 20 medals (D) 20% (E) 5% per medal (F) 5% per scout v. The height of the block for 21-30 medals is: (A) 5% (B) 5% per medal (C) 1/2% per medal (D) 5/9% per medal (E) 10 medals vi. The endpoints of the base of the block for 1 or 2 medals are: (A) 1 and 2 (B) 1.5 and 2.5 (C) 0 and 3 (D) 0.5 and 2.5 (E) 1 and 3 (F) 0 and 2 (B) percent (D) propensity (E) counting (B) percent of scouts (C) percent of scouts per medal vii. Which block is the most dense? (A) 1-2 (B) 3-5 (C) 8-11 (D) 12-15

Functions and Change: A Modeling Approach to College Algebra (MindTap Course List)
6th Edition
ISBN:9781337111348
Author:Bruce Crauder, Benny Evans, Alan Noell
Publisher:Bruce Crauder, Benny Evans, Alan Noell
Chapter5: A Survey Of Other Common Functions
Section5.6: Higher-degree Polynomials And Rational Functions
Problem 5E: Population Genetics In the study of population genetics, an important measure of inbreeding is the...

Related questions
Question
Question 1
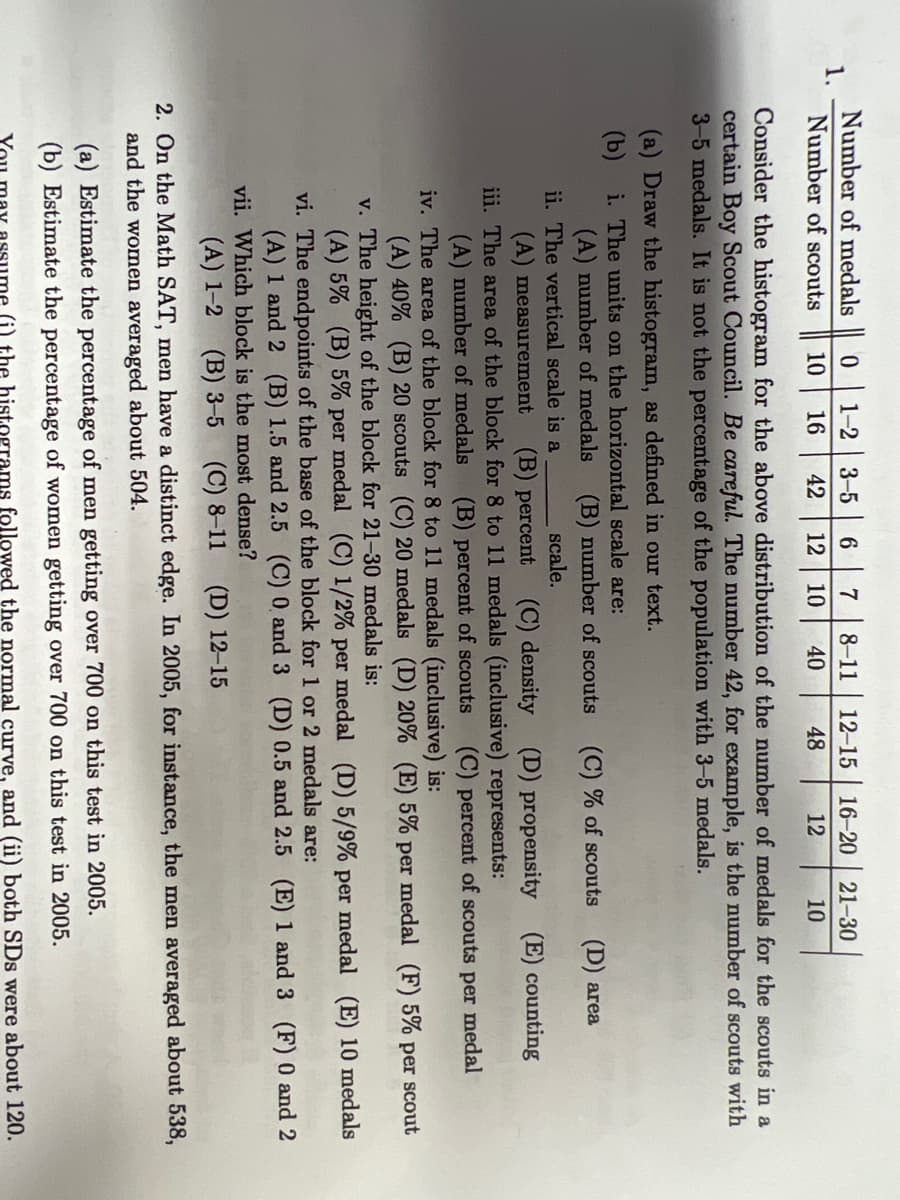
Transcribed Image Text:Number of medals
1.
Number of scouts
1-2
3-5
6
7
8-11
12-15
16-20 21-30
10
16
42
12
10
40
48
12
10
Consider the histogram for the above distribution of the number of medals for the scouts in a
certain Boy Scout Council. Be careful. The number 42, for example, is the number of scouts with
3-5 medals. It is not the percentage of the population with 3-5 medals.
(a) Draw the histogram, as defined in our text.
(b)
i. The units on the horizontal scale are:
(A) number of medals
(B) number of scouts
(C) % of scouts
(D) area
ii. The vertical scale is a
scale.
(C) density (D) propensity (E) counting
(A) measurement
iii. The area of the block for 8 to 11 medals (inclusive) represents:
(A) number of medals (B) percent of scouts
iv. The area of the block for 8 to 11 medals (inclusive) is:
(A) 40% (B) 20 scouts (C) 20 medals (D) 20% (E) 5% per medal (F) 5%
v. The height of the block for 21-30 medals is:
(A) 5% (B) 5% per medal (C) 1/2% per medal (D) 5/9% per medal (E) 10 medals
(B) реrcent
(C) percent of scouts per medal
O per
scout
vi. The endpoints of the base of the block for 1 or 2 medals are:
(A) 1 and 2 (B) 1.5 and 2.5 (C) 0 and 3 (D) 0.5 and 2.5 (E) 1 and 3 (F) 0 and 2
vii. Which block is the most dense?
(A) 1-2 (B) 3-5
(C) 8-11
(D) 12-15
2. On the Math SAT, men have a distinct edge. In 2005, for instance, the men averaged about 538,
and the women averaged about 504.
(a) Estimate the percentage of men getting over 700 on this test in 2005.
(b) Estimate the percentage of women getting over 700 on this test in 2005.
(i) the histograms followed the normal curve, and (ii) both SDs were about 120.
Expert Solution
This question has been solved!
Explore an expertly crafted, step-by-step solution for a thorough understanding of key concepts.

This is a popular solution!

Trending now
This is a popular solution!

Step by step
Solved in 2 steps with 1 images

Recommended textbooks for you
Functions and Change: A Modeling Approach to Coll…
Algebra
ISBN:
9781337111348
Author:
Bruce Crauder, Benny Evans, Alan Noell
Publisher:
Cengage Learning

Big Ideas Math A Bridge To Success Algebra 1: Stu…
Algebra
ISBN:
9781680331141
Author:
HOUGHTON MIFFLIN HARCOURT
Publisher:
Houghton Mifflin Harcourt
Functions and Change: A Modeling Approach to Coll…
Algebra
ISBN:
9781337111348
Author:
Bruce Crauder, Benny Evans, Alan Noell
Publisher:
Cengage Learning
Big Ideas Math A Bridge To Success Algebra 1: Stu…
Algebra
ISBN:
9781680331141
Author:
HOUGHTON MIFFLIN HARCOURT
Publisher:
Houghton Mifflin Harcourt