O A. OC. OD. 70- 70- 70- 70- 20+ 20 Best Actress (years) O 20- 20 Best Actress (years) 20- 20 Best Actress (years) 20+ 20 Best Actress (years) 70 70 70 70 The linear correlation coefficient is r= (Round to three decimal places as needed.) Determine the null and alternative hypotheses. Ho: P (Type integers or decimals. Do not round.) The test statistic is t=. (Round to two decimal places as needed.) The P-value is. (Round to three decimal places as needed.) V the significance level, there sufficient Because the P-value of the linear correlation coefficient is evidence to support the claim that there is a linear correlation between the ages of Best Actresses and Best Actors. Should we expect that there would be a correlation? O o回 口 Best Actor (years) 口 口|||| | Best Actor (years) B. Best Actor (years) 口口■ Best Actor (years)
O A. OC. OD. 70- 70- 70- 70- 20+ 20 Best Actress (years) O 20- 20 Best Actress (years) 20- 20 Best Actress (years) 20+ 20 Best Actress (years) 70 70 70 70 The linear correlation coefficient is r= (Round to three decimal places as needed.) Determine the null and alternative hypotheses. Ho: P (Type integers or decimals. Do not round.) The test statistic is t=. (Round to two decimal places as needed.) The P-value is. (Round to three decimal places as needed.) V the significance level, there sufficient Because the P-value of the linear correlation coefficient is evidence to support the claim that there is a linear correlation between the ages of Best Actresses and Best Actors. Should we expect that there would be a correlation? O o回 口 Best Actor (years) 口 口|||| | Best Actor (years) B. Best Actor (years) 口口■ Best Actor (years)

Glencoe Algebra 1, Student Edition, 9780079039897, 0079039898, 2018
18th Edition
ISBN:9780079039897
Author:Carter
Publisher:Carter
Chapter4: Equations Of Linear Functions
Section4.5: Correlation And Causation
Problem 15PPS

Related questions
Question
Solve all parts , second photo is the graph that was requested.
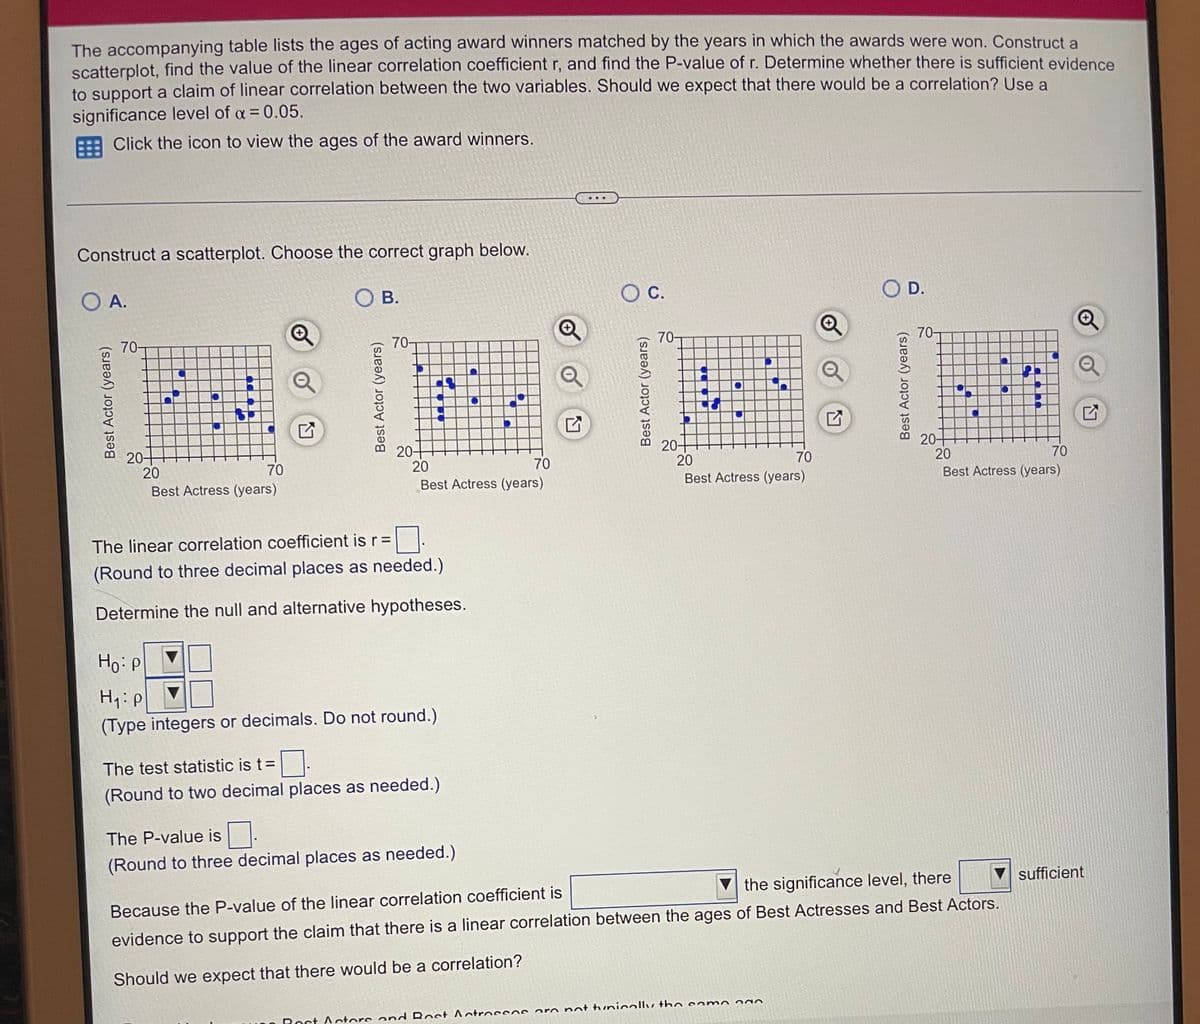
Transcribed Image Text:The accompanying table lists the ages of acting award winners matched by the years in which the awards were won. Construct a
scatterplot, find the value of the linear correlation coefficient r, and find the P-value of r. Determine whether there is sufficient evidence
to support a claim of linear correlation between the two variables. Should we expect that there would be a correlation? Use a
significance level of a = 0.05.
Click the icon to view the ages of the award winners.
Construct a scatterplot. Choose the correct graph below.
O B.
C.
OD.
O A.
В.
70-
70
70-
70-
20-
20
20-
20
20-
20
70
70
20-
20
70
70
Best Actress (years)
Best Actress (years)
Best Actress (years)
Best Actress (years)
The linear correlation coefficient is r =
(Round to three decimal places as needed.)
Determine the null and alternative hypotheses.
Ho: P
(Type integers or decimals. Do not round.)
The test statistic is t=
(Round to two decimal places as needed.)
The P-value is.
(Round to three decimal places as needed.)
V sufficient
the significance level, there
Because the P-value of the linear correlation coefficient is
evidence to support the claim that there is a linear correlation between the ages of Best Actresses and Best Actors.
Should we expect that there would be a correlation?
Rost Actors and Rost Aotroscosare not tunically th nsamo n0
Best Actor (years)
Best Actor (years)
Transcribed Image Text:he accompanying table lists the ages of acting award winners matched by the years in which the awards were won. Construct a
catterplot, find the value of the linear correlation coefficient r, and find the P-value of r. Determine whether there is sufficient evidence
support a claim of linear correlation between the two variables. Should we expect that there would be a correlation? Use a
gnificance level of a= 0.05.
Click the icon to view the ages of the award winners.
struct a scatterplot. Choose the correct graph below.
B.
Oc.
C.
D.
70-
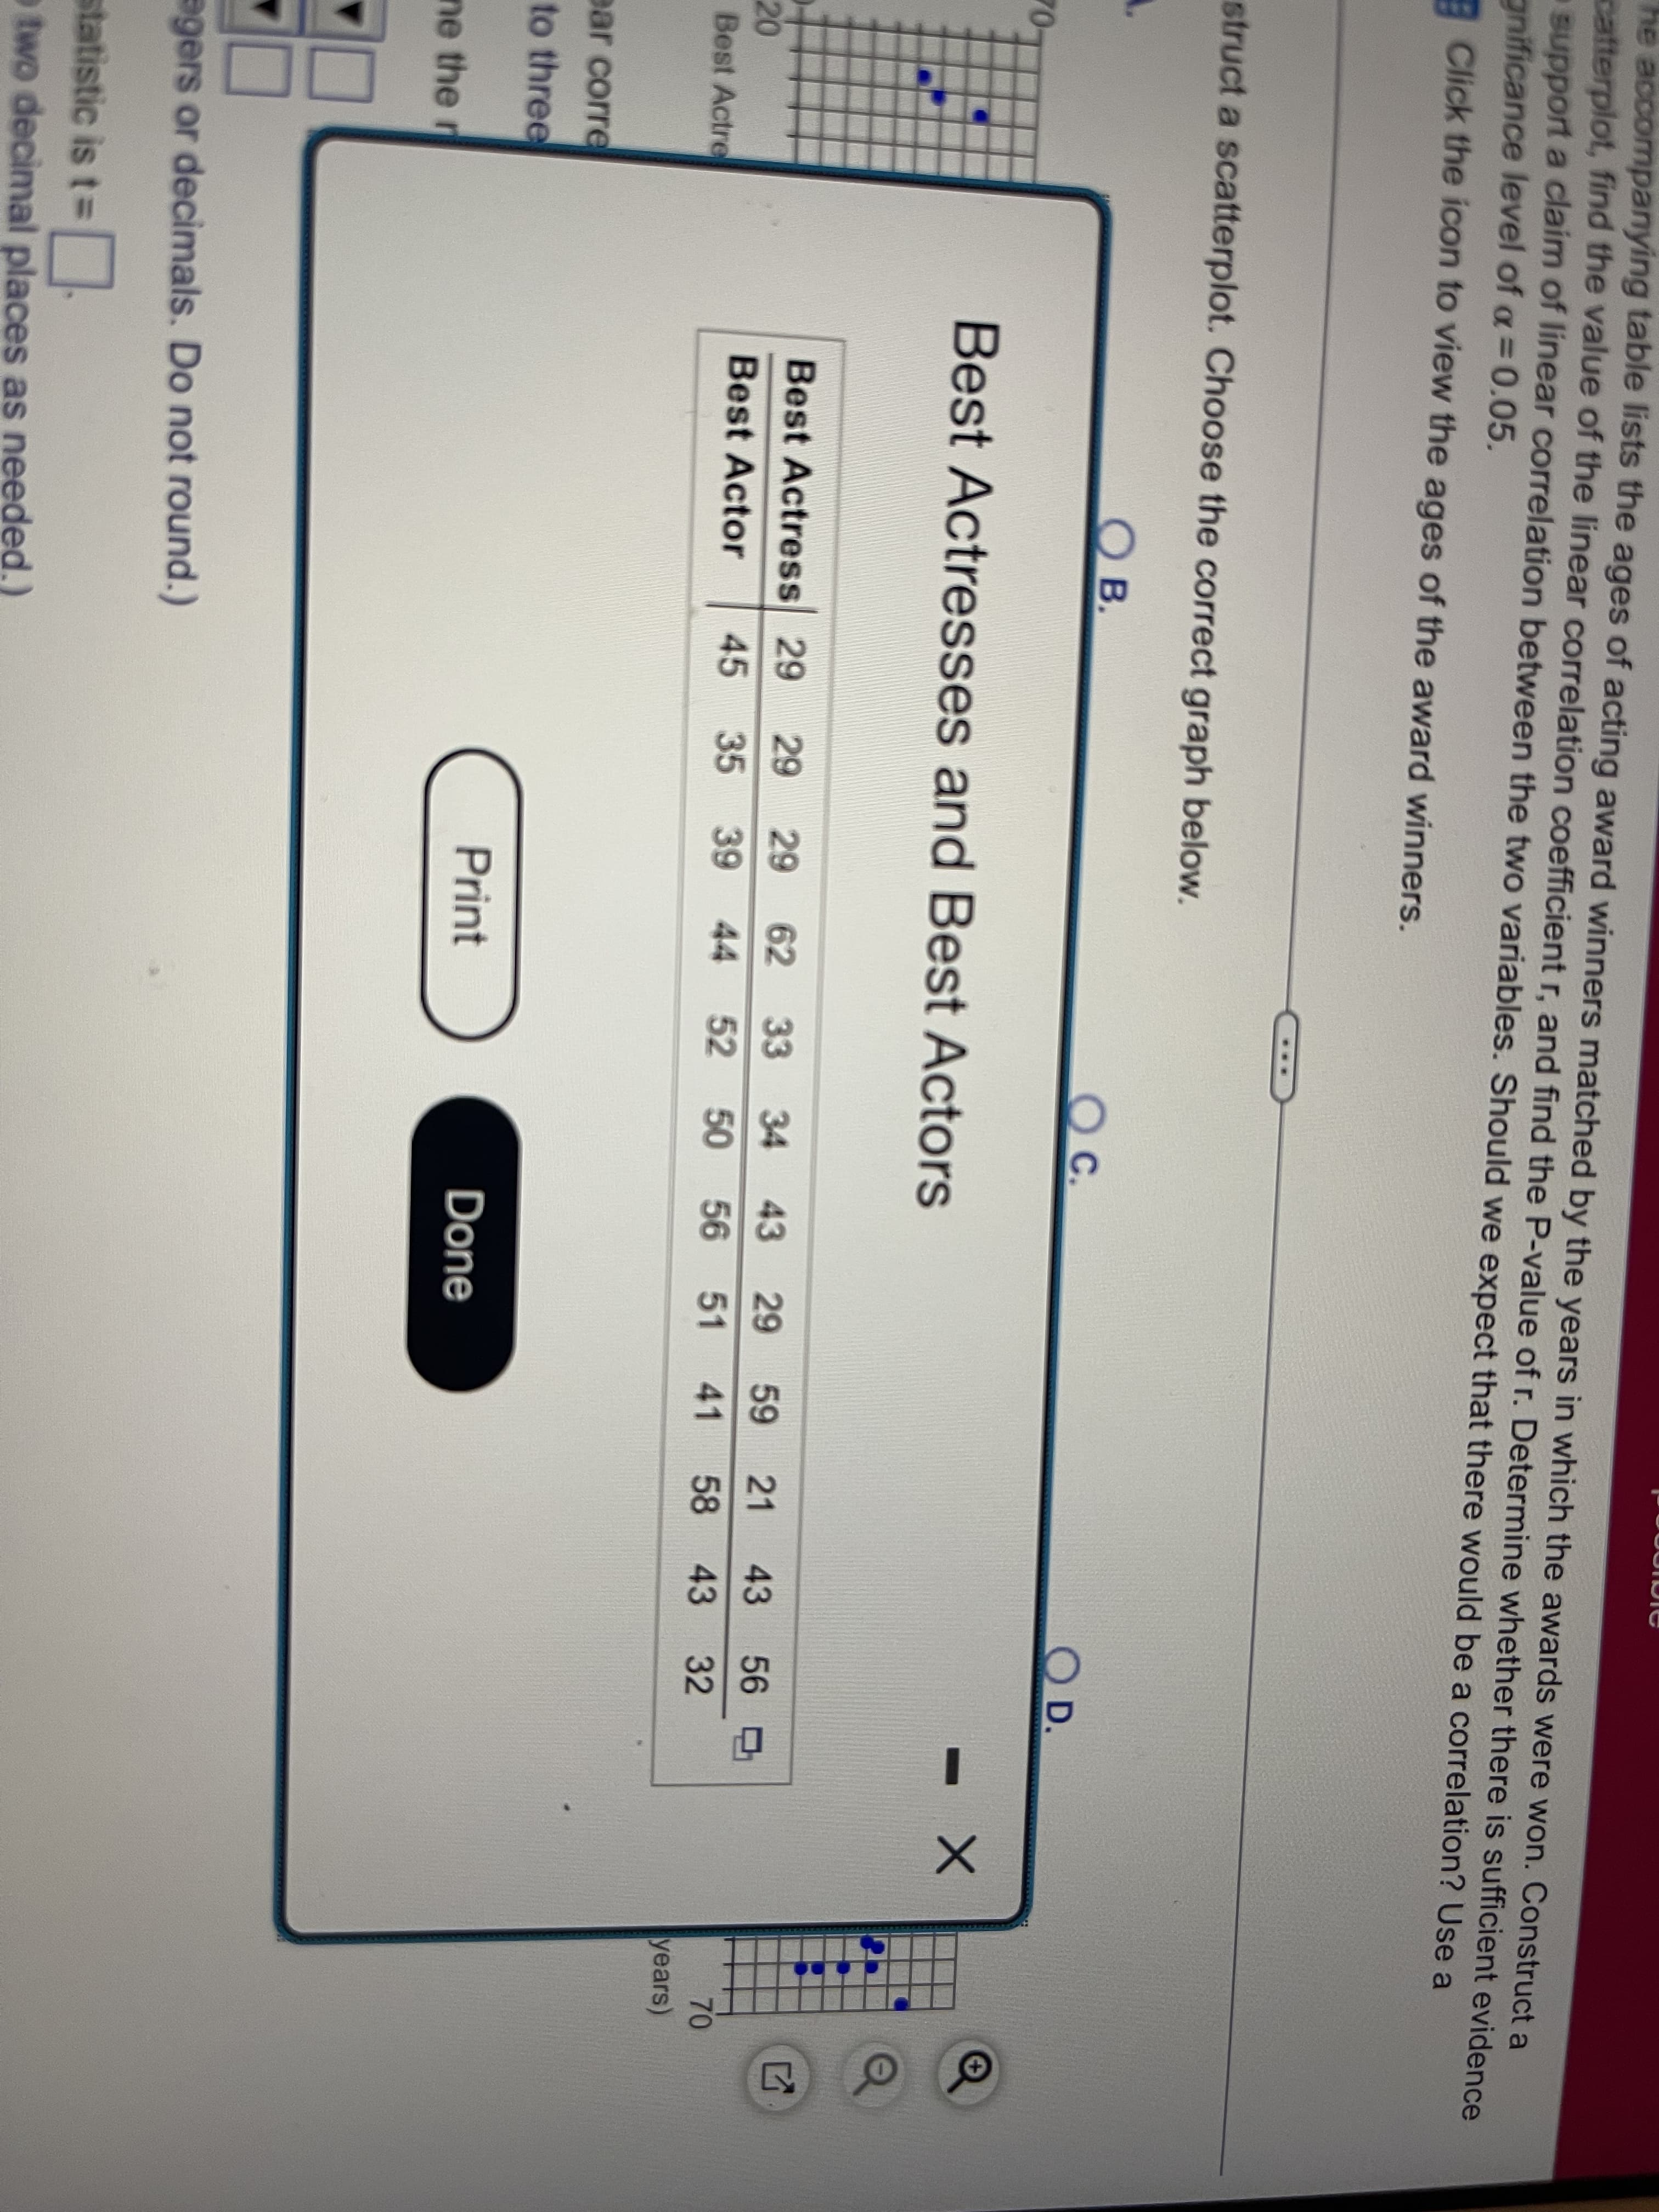
Best Actresses and Best Actors
Best Actress 29
29
62 33
34
43
29
59
21
43
56
70
20
Best Actre
Best Actor
45
35
39 44 52 50 56 51
41
58 43
32
years)
ear corre
to three
Print
Done
ne the r
agers or decimals. Do not round.)
statistic is t3D
o two decimal places as needed.)
29
Expert Solution
This question has been solved!
Explore an expertly crafted, step-by-step solution for a thorough understanding of key concepts.

Step by step
Solved in 3 steps with 5 images

Recommended textbooks for you
Glencoe Algebra 1, Student Edition, 9780079039897…
Algebra
ISBN:
9780079039897
Author:
Carter
Publisher:
McGraw Hill

Big Ideas Math A Bridge To Success Algebra 1: Stu…
Algebra
ISBN:
9781680331141
Author:
HOUGHTON MIFFLIN HARCOURT
Publisher:
Houghton Mifflin Harcourt
Glencoe Algebra 1, Student Edition, 9780079039897…
Algebra
ISBN:
9780079039897
Author:
Carter
Publisher:
McGraw Hill
Big Ideas Math A Bridge To Success Algebra 1: Stu…
Algebra
ISBN:
9781680331141
Author:
HOUGHTON MIFFLIN HARCOURT
Publisher:
Houghton Mifflin Harcourt