of people employed: e) Was this change in the number of people employed due to a shift or a movement along the demand curve? (circle your answer) Shift Movement Along f) Intuition: Why does the profit maximizing level of labor input change with the living wage program (make sure you write out the profit maximizing condition and explain why it has changed i.e., why does the hiring company rationally change their quantity demanded of labor the way they did)? 2) Intuition. We also experience a movement along the labor supply curve. Explain the intuition here as in why are more people are willing to work using and explaining the substitution and income effects associated with labor supply. Which effect dominates and what has happened to the price of leisure given the living wage program?
of people employed: e) Was this change in the number of people employed due to a shift or a movement along the demand curve? (circle your answer) Shift Movement Along f) Intuition: Why does the profit maximizing level of labor input change with the living wage program (make sure you write out the profit maximizing condition and explain why it has changed i.e., why does the hiring company rationally change their quantity demanded of labor the way they did)? 2) Intuition. We also experience a movement along the labor supply curve. Explain the intuition here as in why are more people are willing to work using and explaining the substitution and income effects associated with labor supply. Which effect dominates and what has happened to the price of leisure given the living wage program?
Principles of Economics 2e
2nd Edition
ISBN:9781947172364
Author:Steven A. Greenlaw; David Shapiro
Publisher:Steven A. Greenlaw; David Shapiro
Chapter24: The Aggregate Demand/aggregate Supply Model
Section: Chapter Questions
Problem 61P: Table 24.4 describes Santhers economy. Plot the AD/AS curves and identify the equilibrium. Would you...
Related questions
Question
e,f,g all answer do it please fast

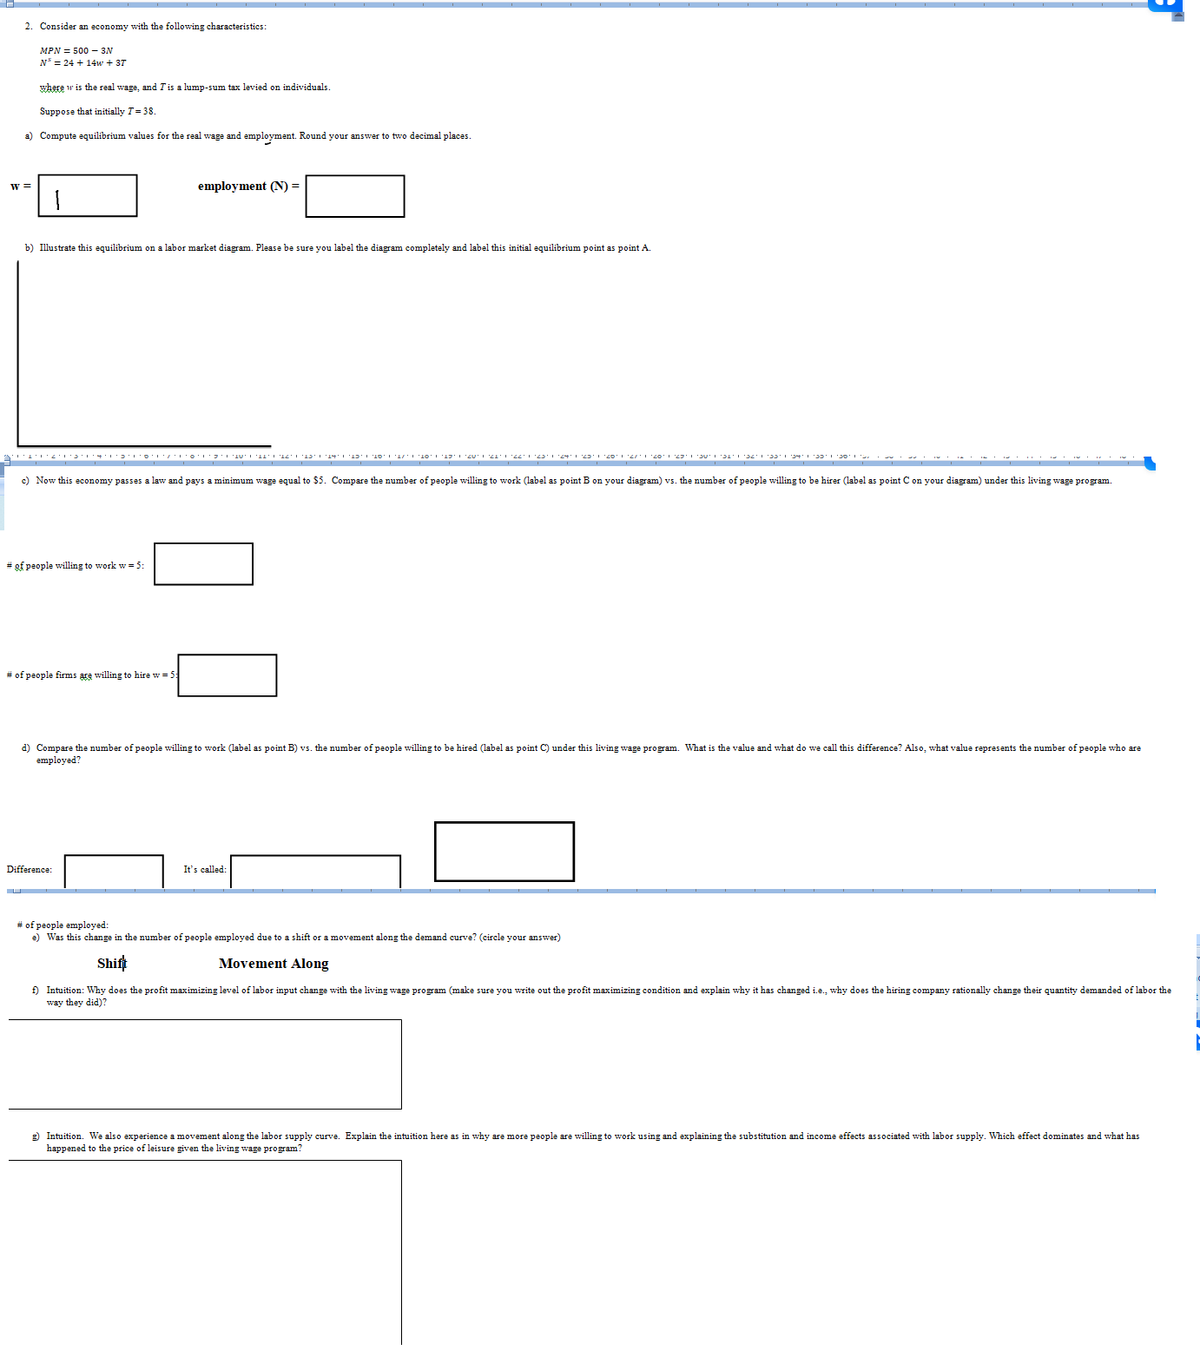
Transcribed Image Text:2. Consider an economy with the following characteristics:
MPN = 500 - 3N
N³ = 24 + 14w + 37
where w is the real wage, and I is a lump-sum tax levied on individuals.
Suppose that initially T = 38.
a) Compute equilibrium values for the real wage and employment. Round your answer to two decimal places.
W =
b) Illustrate this equilibrium on a labor market diagram. Please be sure you label the diagram completely and label this initial equilibrium point as point A.
# of people willing to work w = 5:
employment (N) =
c) Now this economy passes a law and pays a minimum wage equal to $5. Compare the number of people willing to work (label: point B on your diagram) vs. the number of people willing to be hirer (label as point C on your diagram) under this living wage program.
# of people firms are willing to hire w = 5
011121314102022''22' 1·23·1·24 23·20 2/1 20 23 30 31 32 33 34 35 30
Difference:
d) Compare the number of people willing to work (label point B) vs. the number of people willing to be hired (label as point C) under this living wage program. What is the value and what do we call this difference? Also, what value represents the number of people who are
employed?
It's called:
# of people employed:
e) Was this change in the number of people employed due to a shift or a movement along the demand curve? (circle your answer)
Shift
Movement Along
f) Intuition: Why does the profit maximizing level of labor input change with the living wage program (make sure you write out the profit maximizing condition and explain why it has changed i.e., why does the hiring company rationally change their quantity demanded of labor the
way they did)?
g) Intuition. We also experience a movement along the labor supply curve. Explain the intuition here as in why are more people are willing to work using and explaining the substitution and income effects associated with labor supply. Which effect dominates and what has
happened to the price of leisure given the living wage program?
Expert Solution
This question has been solved!
Explore an expertly crafted, step-by-step solution for a thorough understanding of key concepts.
Step by step
Solved in 5 steps

Knowledge Booster
Learn more about
Need a deep-dive on the concept behind this application? Look no further. Learn more about this topic, economics and related others by exploring similar questions and additional content below.Recommended textbooks for you

Principles of Economics 2e
Economics
ISBN:
9781947172364
Author:
Steven A. Greenlaw; David Shapiro
Publisher:
OpenStax


Principles of Economics 2e
Economics
ISBN:
9781947172364
Author:
Steven A. Greenlaw; David Shapiro
Publisher:
OpenStax
