olaris Pte Ltd is a manufacturer of solar panels used by many organisations in solar farms to produce electricity in Singapore. The last few years had been tough. The COVID19 pandemic had shutdown many economic activities leading to poor sales in solar panels. In more recent times, with many countries in the world embracing endemic COVID and opening up their borders, economic activities are restarting. The CEO of Solaris is optimi
olaris Pte Ltd is a manufacturer of solar panels used by many organisations in solar farms to produce electricity in Singapore. The last few years had been tough. The COVID19 pandemic had shutdown many economic activities leading to poor sales in solar panels. In more recent times, with many countries in the world embracing endemic COVID and opening up their borders, economic activities are restarting. The CEO of Solaris is optimi

Holt Mcdougal Larson Pre-algebra: Student Edition 2012
1st Edition
ISBN:9780547587776
Author:HOLT MCDOUGAL
Publisher:HOLT MCDOUGAL
Chapter11: Data Analysis And Probability
Section11.5: Interpreting Data
Problem 1C

Related questions
Question
Solaris Pte Ltd is a manufacturer of solar panels used by many organisations in solar farms to
produce electricity in Singapore. The last few years had been tough. The COVID19 pandemic
had shutdown many economic activities leading to poor sales in solar panels. In more recent
times, with many countries in the world embracing endemic COVID and opening up their
borders, economic activities are restarting. The CEO of Solaris is optimistic even though there
are other challenges like sharp spikes in oil and gas prices, war in Ukraine and frequent supply
chain disruptions
Table 4 shows the past quarterly sales data of solar panels sold by Solaris in terms of units per
quarter for the last three years. Sales data are only available right up to the second quarter of
2022. The CEO would like its sales manager to forecast sales for the next 4 quarters ahead
from 2022 Q3 to 2023 Q2.
Suppose you are the Sales Manager at Solaris. Using the Weighted Moving Average (WMA)
method, develop a quarterly sales forecast for the solar panels.
(i) What is your sales forecast for 2022Q3 through 2023Q2? You may assume that the weights
are 2:3:1 where weight 2 is for the oldest data point and weight 1 is for the most recent
data. What is the Mean Absolute Deviation (MAD) of your forecast? (Note: you need to
show how the first two (2) values of your WMA, Absolute Error and final MAD are
computed.)
(ii) Comment on your new forecasts in terms of its reliability for business planning.
(Hint: consider plotting a graph of your new forecast for analysis.)
Do provide all equations, tables, graphs and working
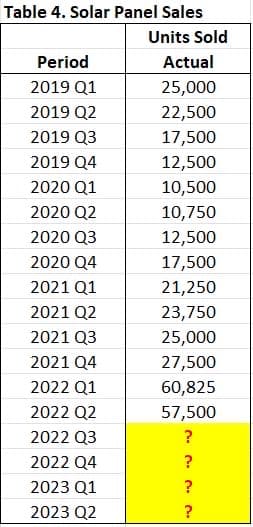
Transcribed Image Text:Table 4. Solar Panel Sales
Period
2019 Q1
2019 Q2
2019 Q3
2019 Q4
2020 Q1
2020 Q2
2020 Q3
2020 Q4
2021 Q1
2021 Q2
2021 Q3
2021 Q4
2022 Q1
2022 Q2
2022 Q3
2022 Q4
2023 Q1
2023 Q2
Units Sold
Actual
25,000
22,500
17,500
12,500
10,500
10,750
12,500
17,500
21,250
23,750
25,000
27,500
60,825
57,500
?
?
?
?
Expert Solution
This question has been solved!
Explore an expertly crafted, step-by-step solution for a thorough understanding of key concepts.

Step by step
Solved in 4 steps with 3 images

Recommended textbooks for you
Holt Mcdougal Larson Pre-algebra: Student Edition…
Algebra
ISBN:
9780547587776
Author:
HOLT MCDOUGAL
Publisher:
HOLT MCDOUGAL
Holt Mcdougal Larson Pre-algebra: Student Edition…
Algebra
ISBN:
9780547587776
Author:
HOLT MCDOUGAL
Publisher:
HOLT MCDOUGAL