ompute Costco’s current ratio and quick ratio for 2006 and 2005. (Round answers two decimal places.) 2006 current ratio =? 2005 current ratio =? 2006 quick ratio =? 2005 quick ratio =? (b) Compute Target's times interest earned and its liabilities-to-equity ratios for 2006 and 2005. (Round your answers to two decimal places.) 2006 times interest earned =? 2005 times interest earned =? 2006 liabilities-to-equity =? 2005 liabilities-to-equity =? Comment on any observed trends. Which of the following statements best describes any trend in Target's liabilities-to-equity ratios? Choose the right Option from below a)The decrease in Target's liabilities-to-equity ratio remained constant. b)Target's liabilities-to-equity ratio decreased slightly in 2006, we have no concerns about Target's's ability to meet its debt obligations. c)Target's liabilities-to-equity ratio increased during the year primarily due to a decrease in its equity. d)Target's liabilities-to-equity ratio decreased due to a decrease in its equity.
ompute Costco’s current ratio and quick ratio for 2006 and 2005. (Round answers two decimal places.) 2006 current ratio =? 2005 current ratio =? 2006 quick ratio =? 2005 quick ratio =? (b) Compute Target's times interest earned and its liabilities-to-equity ratios for 2006 and 2005. (Round your answers to two decimal places.) 2006 times interest earned =? 2005 times interest earned =? 2006 liabilities-to-equity =? 2005 liabilities-to-equity =? Comment on any observed trends. Which of the following statements best describes any trend in Target's liabilities-to-equity ratios? Choose the right Option from below a)The decrease in Target's liabilities-to-equity ratio remained constant. b)Target's liabilities-to-equity ratio decreased slightly in 2006, we have no concerns about Target's's ability to meet its debt obligations. c)Target's liabilities-to-equity ratio increased during the year primarily due to a decrease in its equity. d)Target's liabilities-to-equity ratio decreased due to a decrease in its equity.

Managerial Accounting
15th Edition
ISBN:9781337912020
Author:Carl Warren, Ph.d. Cma William B. Tayler
Publisher:Carl Warren, Ph.d. Cma William B. Tayler
Chapter16: Financial Statement Analysis
Section: Chapter Questions
Problem 24E

Related questions
Question
a) Compute Costco’s
2006 current ratio =?
2005 current ratio =?
2006 quick ratio =?
2005 quick ratio =?
(b) Compute Target's times interest earned and its liabilities-to-equity ratios for 2006 and 2005. (Round your answers to two decimal places.)
2006 times interest earned =?
2005 times interest earned =?
2006 liabilities-to-equity =?
2005 liabilities-to-equity =?
Comment on any observed trends. Which of the following statements best describes any trend in Target's liabilities-to-equity ratios? Choose the right Option from below
a)The decrease in Target's liabilities-to-equity ratio remained constant.
b)Target's liabilities-to-equity ratio decreased slightly in 2006, we have no concerns about Target's's ability to meet its debt obligations.
c)Target's liabilities-to-equity ratio increased during the year primarily due to a decrease in its equity.
d)Target's liabilities-to-equity ratio decreased due to a decrease in its equity.
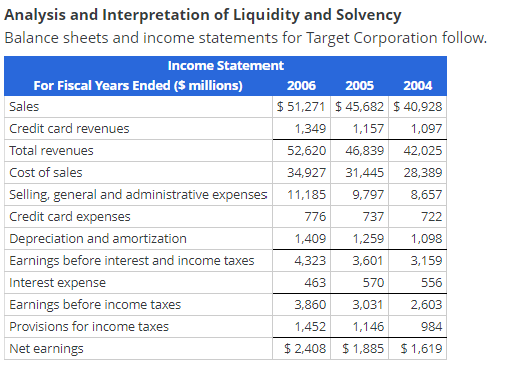
Transcribed Image Text:Analysis and Interpretation of Liquidity and Solvency
Balance sheets and income statements for Target Corporation follow.
For Fiscal Years Ended ($ millions)
Sales
Credit card revenues
Income Statement
Total revenues
Cost of sales
Selling, general and administrative expenses
Credit card expenses
Depreciation and amortization
Earnings before interest and income taxes
Interest expense
Earnings before income taxes
Provisions for income taxes
Net earnings
2006 2005
2004
$51,271 $45,682 $ 40,928
1,349
1,157
1,097
52,620 46,839
42,025
34,927 31,445
28,389
11,185
9,797
8,657
776
737
722
1,409
1,259
1,098
4,323
3,601
3,159
463
570
556
3,860
3,031
2,603
1,452
1,146
984
$2,408 $1,885
$1,619
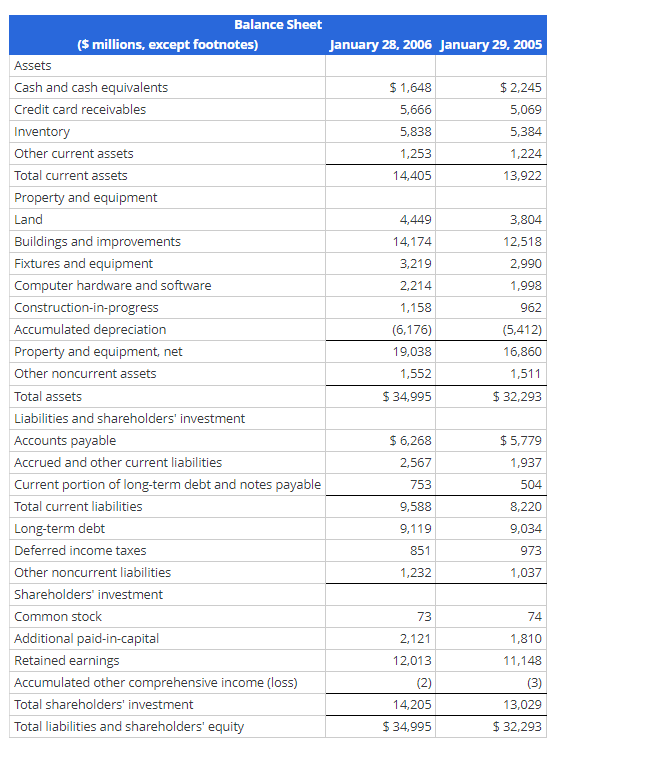
Transcribed Image Text:($ millions, except footnotes)
Assets
Cash and cash equivalents
Credit card receivables
Inventory
Other current assets
Total current assets
Property and equipment
Land
Buildings and improvements
Fixtures and equipment
Computer hardware and software
Construction-in-progress
Accumulated depreciation
Property and equipment, net
Other noncurrent assets
Total assets
Balance Sheet
Liabilities and shareholders' investment
Accounts payable
Accrued and other current liabilities
Current portion of long-term debt and notes payable
Total current liabilities
Long-term debt
Deferred income taxes
Other noncurrent liabilities
Shareholders' investment
Common stock
Additional paid-in-capital
Retained earnings
Accumulated other comprehensive income (loss)
Total shareholders' investment
Total liabilities and shareholders' equity
January 28, 2006 January 29, 2005
$1,648
5,666
5,838
1,253
14,405
4,449
14,174
3,219
2,214
1,158
(6,176)
19,038
1,552
$ 34,995
$ 6,268
2,567
753
9,588
9,119
851
1,232
73
2,121
12,013
(2)
14,205
$ 34,995
$2,245
5,069
5,384
1,224
13,922
3,804
12,518
2,990
1,998
962
(5,412)
16,860
1,511
$ 32,293
$5,779
1,937
504
8,220
9,034
973
1,037
74
1,810
11,148
(3)
13,029
$ 32,293
Expert Solution
This question has been solved!
Explore an expertly crafted, step-by-step solution for a thorough understanding of key concepts.

This is a popular solution!

Trending now
This is a popular solution!

Step by step
Solved in 2 steps

Knowledge Booster


Learn more about
Need a deep-dive on the concept behind this application? Look no further. Learn more about this topic, accounting and related others by exploring similar questions and additional content below.Recommended textbooks for you
Managerial Accounting
Accounting
ISBN:
9781337912020
Author:
Carl Warren, Ph.d. Cma William B. Tayler
Publisher:
South-Western College Pub

Financial And Managerial Accounting
Accounting
ISBN:
9781337902663
Author:
WARREN, Carl S.
Publisher:
Cengage Learning,

Financial Accounting: The Impact on Decision Make…
Accounting
ISBN:
9781305654174
Author:
Gary A. Porter, Curtis L. Norton
Publisher:
Cengage Learning
Managerial Accounting
Accounting
ISBN:
9781337912020
Author:
Carl Warren, Ph.d. Cma William B. Tayler
Publisher:
South-Western College Pub
Financial And Managerial Accounting
Accounting
ISBN:
9781337902663
Author:
WARREN, Carl S.
Publisher:
Cengage Learning,
Financial Accounting: The Impact on Decision Make…
Accounting
ISBN:
9781305654174
Author:
Gary A. Porter, Curtis L. Norton
Publisher:
Cengage Learning

Cornerstones of Financial Accounting
Accounting
ISBN:
9781337690881
Author:
Jay Rich, Jeff Jones
Publisher:
Cengage Learning


Financial Accounting
Accounting
ISBN:
9781305088436
Author:
Carl Warren, Jim Reeve, Jonathan Duchac
Publisher:
Cengage Learning