On a certain day, the electric power in thousands of megawatts used by a major city can be approximated by the following graph below, where tis the number of hours since midnight for 0 st<24. P(t) 24 22 20 18 16 14 12 10 8. 9. 4 2 4. 8 10 12 14 16 18 20 22 |24 26 28 30 How should the average rate of change between t= 16 and t= 22 be interpreted? O Between these times, about 500 more megawatts of electricity are used every hour. O Between these times, about 500 fewer megawatts of electricity are used every hour. O Between these times, about 2,000 more megawatts of electricity are used every hour.
On a certain day, the electric power in thousands of megawatts used by a major city can be approximated by the following graph below, where tis the number of hours since midnight for 0 st<24. P(t) 24 22 20 18 16 14 12 10 8. 9. 4 2 4. 8 10 12 14 16 18 20 22 |24 26 28 30 How should the average rate of change between t= 16 and t= 22 be interpreted? O Between these times, about 500 more megawatts of electricity are used every hour. O Between these times, about 500 fewer megawatts of electricity are used every hour. O Between these times, about 2,000 more megawatts of electricity are used every hour.

Big Ideas Math A Bridge To Success Algebra 1: Student Edition 2015
1st Edition
ISBN:9781680331141
Author:HOUGHTON MIFFLIN HARCOURT
Publisher:HOUGHTON MIFFLIN HARCOURT
Chapter8: Graphing Quadratic Functions
Section: Chapter Questions
Problem 30CR

Related questions
Question
29
A. Between these times, about 2,000 more megawatts of eletricity are used every hour.
B. Between these times, about 500 fewer megawatts of electricity are used every hour.
C. Between these times, about 500 or more megawatts of electricity are used every hour
D. Between these times, about 2,00 fewer megawatts of electricity are used every hour.
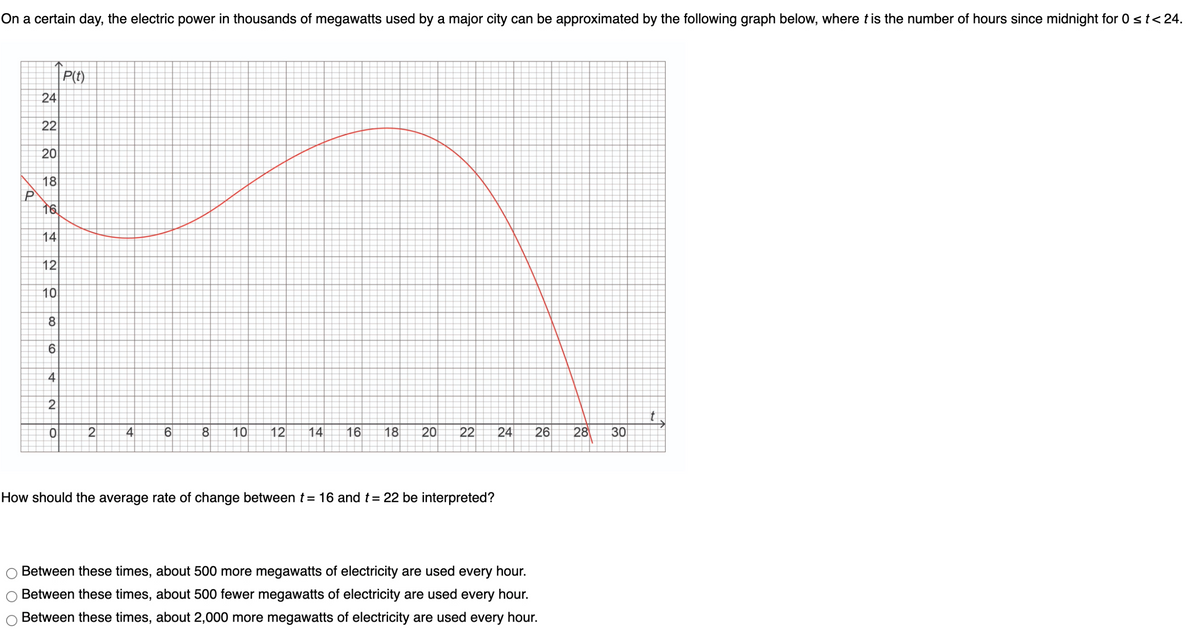
Transcribed Image Text:On a certain day, the electric power in thousands of megawatts used by a major city can be approximated by the following graph below, where t is the number of hours since midnight for 0 st< 24.
P(t)
24
22
20
18
P
16
14
12
10
8.
4
2
4
6
10
12
14
16
18
20
22
24
26
28
How should the average rate of change between t = 16 and t= 22 be interpreted?
Between these times, about 500 more megawatts of electricity are used every hour.
Between these times, about 500 fewer megawatts of electricity are used every hour.
Between these times, about 2,000 more megawatts of electricity are used every hour.
30
|00
Expert Solution
This question has been solved!
Explore an expertly crafted, step-by-step solution for a thorough understanding of key concepts.

This is a popular solution!

Trending now
This is a popular solution!

Step by step
Solved in 2 steps with 1 images

Recommended textbooks for you
Big Ideas Math A Bridge To Success Algebra 1: Stu…
Algebra
ISBN:
9781680331141
Author:
HOUGHTON MIFFLIN HARCOURT
Publisher:
Houghton Mifflin Harcourt

Trigonometry (MindTap Course List)
Trigonometry
ISBN:
9781337278461
Author:
Ron Larson
Publisher:
Cengage Learning

Big Ideas Math A Bridge To Success Algebra 1: Stu…
Algebra
ISBN:
9781680331141
Author:
HOUGHTON MIFFLIN HARCOURT
Publisher:
Houghton Mifflin Harcourt
Trigonometry (MindTap Course List)
Trigonometry
ISBN:
9781337278461
Author:
Ron Larson
Publisher:
Cengage Learning

Functions and Change: A Modeling Approach to Coll…
Algebra
ISBN:
9781337111348
Author:
Bruce Crauder, Benny Evans, Alan Noell
Publisher:
Cengage Learning

Algebra & Trigonometry with Analytic Geometry
Algebra
ISBN:
9781133382119
Author:
Swokowski
Publisher:
Cengage

Algebra and Trigonometry (MindTap Course List)
Algebra
ISBN:
9781305071742
Author:
James Stewart, Lothar Redlin, Saleem Watson
Publisher:
Cengage Learning