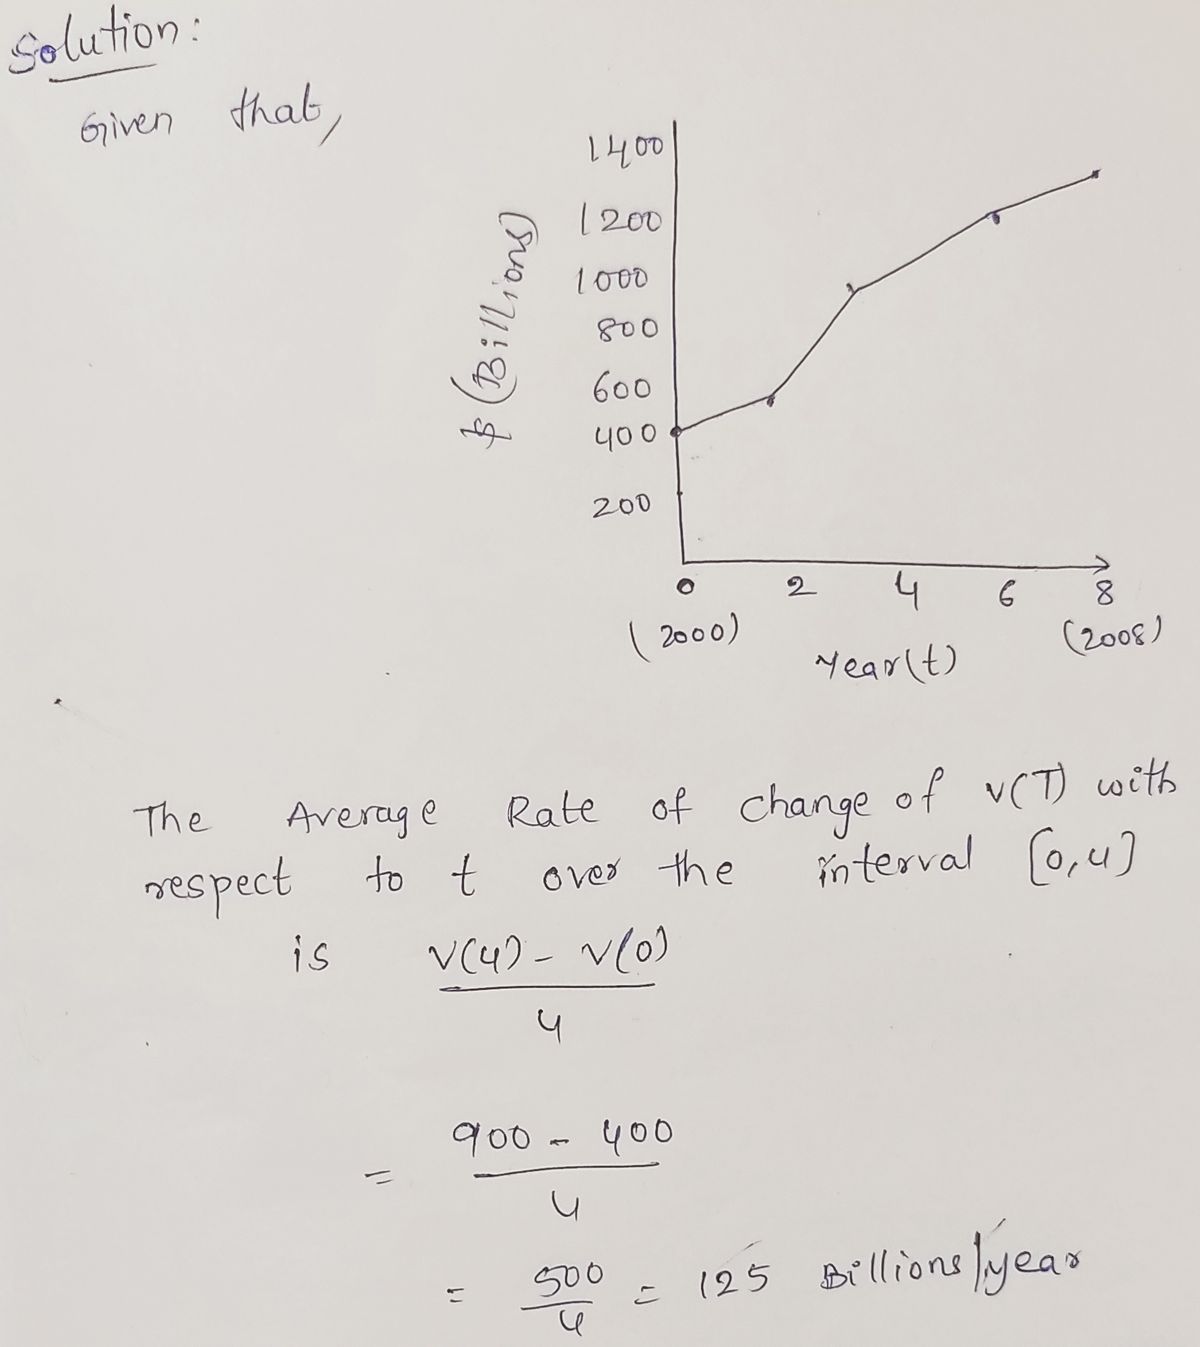
IMT NOTES The following graph shows the approximate value V(t) of subprime (normally classified as risky) mortgage debt outstanding in the United States. Subprime debt outstanding 1,400 1,200 1,000 800 600 %24 400 200 0. 4 6 8. 2000 2008 Year (1) Use the graph to estimate, to one decimal place, the average rate of change of V(t) with respect to t over the interval [0, 4] and interpret the result. The average rate of change is which means that the subprime mortgage debt outstanding was -Select-O ---Select--- O between the years and at an average rate of around $ (Billions)
IMT NOTES The following graph shows the approximate value V(t) of subprime (normally classified as risky) mortgage debt outstanding in the United States. Subprime debt outstanding 1,400 1,200 1,000 800 600 %24 400 200 0. 4 6 8. 2000 2008 Year (1) Use the graph to estimate, to one decimal place, the average rate of change of V(t) with respect to t over the interval [0, 4] and interpret the result. The average rate of change is which means that the subprime mortgage debt outstanding was -Select-O ---Select--- O between the years and at an average rate of around $ (Billions)

MATLAB: An Introduction with Applications
6th Edition
ISBN:9781119256830
Author:Amos Gilat
Publisher:Amos Gilat
Chapter1: Starting With Matlab
Section: Chapter Questions
Problem 1P

Related questions
Question
![The following graph shows the approximate value V(t) of subprime (normally classified as risky) mortgage debt outstanding in the
United States.
Subprime debt outstanding
1,400
1,200
1,000
800
600
400*
200
0.
4
6.
8.
2000
2008
Year (f)
Use the graph to estimate, to one decimal place, the average rate of change of V(t) with respect to t over the interval
[0, 4] and interpret the result.
The average rate of change is
which means that the subprime mortgage debt outstanding was
Select---
---Select---
O between the years
and
at an average rate of arour
$ (Billions)](/v2/_next/image?url=https%3A%2F%2Fcontent.bartleby.com%2Fqna-images%2Fquestion%2F0eec86c2-ff9d-4257-95f5-d93906fa8c4d%2F523aa7b1-d7a5-4295-b412-0a60e3f906ce%2Ffhp3n_processed.jpeg&w=3840&q=75)
Transcribed Image Text:The following graph shows the approximate value V(t) of subprime (normally classified as risky) mortgage debt outstanding in the
United States.
Subprime debt outstanding
1,400
1,200
1,000
800
600
400*
200
0.
4
6.
8.
2000
2008
Year (f)
Use the graph to estimate, to one decimal place, the average rate of change of V(t) with respect to t over the interval
[0, 4] and interpret the result.
The average rate of change is
which means that the subprime mortgage debt outstanding was
Select---
---Select---
O between the years
and
at an average rate of arour
$ (Billions)
Expert Solution
Step 1

Trending now
This is a popular solution!

Step by step
Solved in 2 steps with 2 images

Recommended textbooks for you
MATLAB: An Introduction with Applications
Statistics
ISBN:
9781119256830
Author:
Amos Gilat
Publisher:
John Wiley & Sons Inc

Probability and Statistics for Engineering and th…
Statistics
ISBN:
9781305251809
Author:
Jay L. Devore
Publisher:
Cengage Learning

Statistics for The Behavioral Sciences (MindTap C…
Statistics
ISBN:
9781305504912
Author:
Frederick J Gravetter, Larry B. Wallnau
Publisher:
Cengage Learning
MATLAB: An Introduction with Applications
Statistics
ISBN:
9781119256830
Author:
Amos Gilat
Publisher:
John Wiley & Sons Inc
Probability and Statistics for Engineering and th…
Statistics
ISBN:
9781305251809
Author:
Jay L. Devore
Publisher:
Cengage Learning
Statistics for The Behavioral Sciences (MindTap C…
Statistics
ISBN:
9781305504912
Author:
Frederick J Gravetter, Larry B. Wallnau
Publisher:
Cengage Learning

Elementary Statistics: Picturing the World (7th E…
Statistics
ISBN:
9780134683416
Author:
Ron Larson, Betsy Farber
Publisher:
PEARSON

The Basic Practice of Statistics
Statistics
ISBN:
9781319042578
Author:
David S. Moore, William I. Notz, Michael A. Fligner
Publisher:
W. H. Freeman

Introduction to the Practice of Statistics
Statistics
ISBN:
9781319013387
Author:
David S. Moore, George P. McCabe, Bruce A. Craig
Publisher:
W. H. Freeman