On any given day, a student is either healthy or ill. Of the students who are healthy today, 95 percent will be healthy tomorrow. Of the students who are ill today, 55 percent will be ill tomorrow. Let xo (respectively yo) be the proportion of students who are healthy (respectively ill) on Monday. Let xn (resp. Yn) be the proportion of students who are healthy (resp. ill) after n days. You may define a matrix A: а Example of a 2 × 2 matrix A = such that (: :)(:)-() a b d Xn Xn+1 Yn Yn+1 for all n > 0. Suppose that 20 percent of students are ill on Monday. What percentage of students will still be ill on Tuesday? on Wednesday? in n days? Your teacher thinks about the attandance to class so he wants to know. From the given information above, you determine the ill student percentage is in the long term (as n gets very large). Note : The answer must be an integer and its value must be between 0 and 100.
On any given day, a student is either healthy or ill. Of the students who are healthy today, 95 percent will be healthy tomorrow. Of the students who are ill today, 55 percent will be ill tomorrow. Let xo (respectively yo) be the proportion of students who are healthy (respectively ill) on Monday. Let xn (resp. Yn) be the proportion of students who are healthy (resp. ill) after n days. You may define a matrix A: а Example of a 2 × 2 matrix A = such that (: :)(:)-() a b d Xn Xn+1 Yn Yn+1 for all n > 0. Suppose that 20 percent of students are ill on Monday. What percentage of students will still be ill on Tuesday? on Wednesday? in n days? Your teacher thinks about the attandance to class so he wants to know. From the given information above, you determine the ill student percentage is in the long term (as n gets very large). Note : The answer must be an integer and its value must be between 0 and 100.

Chapter8: Sequences, Series,and Probability
Section: Chapter Questions
Problem 41CT: On a game show, a contestant is given the digits 3, 4, and 5 to arrange in the proper order to form...

Related questions

Concept explainers
Contingency Table
A contingency table can be defined as the visual representation of the relationship between two or more categorical variables that can be evaluated and registered. It is a categorical version of the scatterplot, which is used to investigate the linear relationship between two variables. A contingency table is indeed a type of frequency distribution table that displays two variables at the same time.
Binomial Distribution
Binomial is an algebraic expression of the sum or the difference of two terms. Before knowing about binomial distribution, we must know about the binomial theorem.
Topic Video
Question
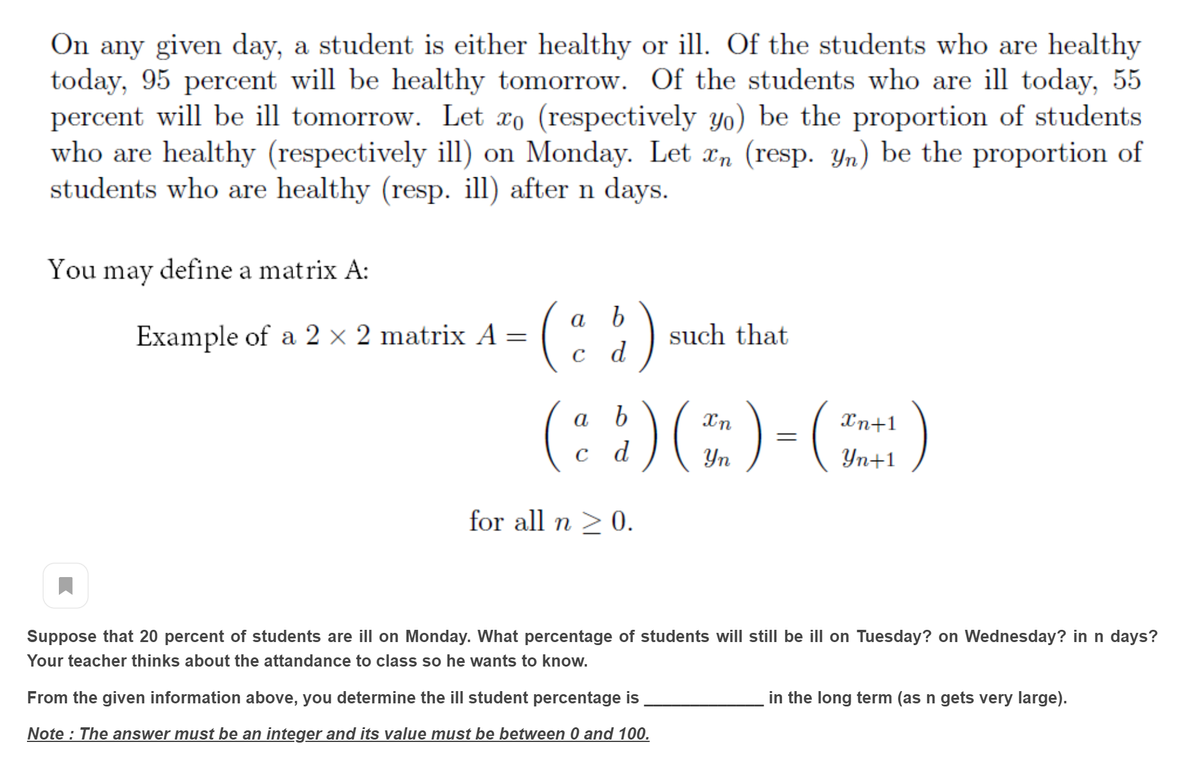
Transcribed Image Text:On any given day, a student is either healthy or ill. Of the students who are healthy
today, 95 percent will be healthy tomorrow. Of the students who are ill today, 55
percent will be ill tomorrow. Let xo (respectively yo) be the proportion of students
who are healthy (respectively ill) on Monday. Let æn (resp. Yn) be the proportion of
students who are healthy (resp. ill) after n days.
You may define a matrix A:
(:)
(: :)(E)-)
Example of a 2 × 2 matrix A =
such that
c d
b
Xn+1
а
Yn
Yn+1
for all n 2 0.
Suppose that 20 percent of students are ill on Monday. What percentage of students will still be ill on Tuesday? on Wednesday? in n days?
Your teacher thinks about the attandance to class so he wants to know.
From the given information above, you determine the ill student percentage is
in the long term (as n gets very large).
Note : The answer must be an integer and its value must be between 0 and 100.
Expert Solution
This question has been solved!
Explore an expertly crafted, step-by-step solution for a thorough understanding of key concepts.

Step by step
Solved in 2 steps with 2 images

Knowledge Booster


Learn more about
Need a deep-dive on the concept behind this application? Look no further. Learn more about this topic, algebra and related others by exploring similar questions and additional content below.Recommended textbooks for you

College Algebra (MindTap Course List)
Algebra
ISBN:
9781305652231
Author:
R. David Gustafson, Jeff Hughes
Publisher:
Cengage Learning

Algebra & Trigonometry with Analytic Geometry
Algebra
ISBN:
9781133382119
Author:
Swokowski
Publisher:
Cengage
College Algebra (MindTap Course List)
Algebra
ISBN:
9781305652231
Author:
R. David Gustafson, Jeff Hughes
Publisher:
Cengage Learning
Algebra & Trigonometry with Analytic Geometry
Algebra
ISBN:
9781133382119
Author:
Swokowski
Publisher:
Cengage

Glencoe Algebra 1, Student Edition, 9780079039897…
Algebra
ISBN:
9780079039897
Author:
Carter
Publisher:
McGraw Hill