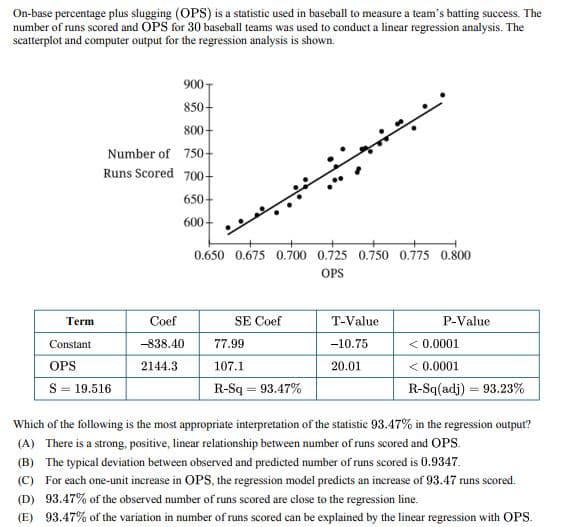
On-base percentage plus slugging (OPS) is a statistic used in baseball to measure a team's batting success. The number of runs scored and OPS for 30 baseball teams was used to conduct a linear regression analysis. The scatterplot and computer output for the regression analysis is shown. 900- 850- 800- Number of 750- Runs Scored 700- 650- 600- 0.650 0.675 0.700 0.725 0.750 0.775 0.800 OPS Term Coef SE Coef Constant -838.40 77.99 OPS 2144.3 107.1 T-Value -10.75 20.01 P-Value <0.0001 < 0.0001 S = 19.516 R-Sq = 93.47% R-Sq(adj) 93.23% Which of the following is the most appropriate interpretation of the statistic 93.47% in the regression output? (A) There is a strong, positive, linear relationship between number of runs scored and OPS. (B) The typical deviation between observed and predicted number of runs scored is 0.9347. (C) For each one-unit increase in OPS, the regression model predicts an increase of 93.47 runs scored. (D) 93.47% of the observed number of runs scored are close to the regression line. (E) 93.47% of the variation in number of runs scored can be explained by the linear regression with OPS.
On-base percentage plus slugging (OPS) is a statistic used in baseball to measure a team's batting success. The number of runs scored and OPS for 30 baseball teams was used to conduct a linear regression analysis. The scatterplot and computer output for the regression analysis is shown. 900- 850- 800- Number of 750- Runs Scored 700- 650- 600- 0.650 0.675 0.700 0.725 0.750 0.775 0.800 OPS Term Coef SE Coef Constant -838.40 77.99 OPS 2144.3 107.1 T-Value -10.75 20.01 P-Value <0.0001 < 0.0001 S = 19.516 R-Sq = 93.47% R-Sq(adj) 93.23% Which of the following is the most appropriate interpretation of the statistic 93.47% in the regression output? (A) There is a strong, positive, linear relationship between number of runs scored and OPS. (B) The typical deviation between observed and predicted number of runs scored is 0.9347. (C) For each one-unit increase in OPS, the regression model predicts an increase of 93.47 runs scored. (D) 93.47% of the observed number of runs scored are close to the regression line. (E) 93.47% of the variation in number of runs scored can be explained by the linear regression with OPS.
Functions and Change: A Modeling Approach to College Algebra (MindTap Course List)
6th Edition
ISBN:9781337111348
Author:Bruce Crauder, Benny Evans, Alan Noell
Publisher:Bruce Crauder, Benny Evans, Alan Noell
Chapter3: Straight Lines And Linear Functions
Section3.CR: Chapter Review Exercises
Problem 15CR: Life Expectancy The following table shows the average life expectancy, in years, of a child born in...
Related questions
Question

Transcribed Image Text:On-base percentage plus slugging (OPS) is a statistic used in baseball to measure a team's batting success. The
number of runs scored and OPS for 30 baseball teams was used to conduct a linear regression analysis. The
scatterplot and computer output for the regression analysis is shown.
900-
850-
800-
Number of 750-
Runs Scored 700-
650-
600-
0.650 0.675 0.700 0.725 0.750 0.775 0.800
OPS
Term
Coef
SE Coef
Constant
-838.40
77.99
OPS
2144.3
107.1
T-Value
-10.75
20.01
P-Value
<0.0001
< 0.0001
S = 19.516
R-Sq = 93.47%
R-Sq(adj) 93.23%
Which of the following is the most appropriate interpretation of the statistic 93.47% in the regression output?
(A) There is a strong, positive, linear relationship between number of runs scored and OPS.
(B) The typical deviation between observed and predicted number of runs scored is 0.9347.
(C) For each one-unit increase in OPS, the regression model predicts an increase of 93.47 runs scored.
(D) 93.47% of the observed number of runs scored are close to the regression line.
(E) 93.47% of the variation in number of runs scored can be explained by the linear regression with OPS.
AI-Generated Solution
Unlock instant AI solutions
Tap the button
to generate a solution
Recommended textbooks for you

Functions and Change: A Modeling Approach to Coll…
Algebra
ISBN:
9781337111348
Author:
Bruce Crauder, Benny Evans, Alan Noell
Publisher:
Cengage Learning

Glencoe Algebra 1, Student Edition, 9780079039897…
Algebra
ISBN:
9780079039897
Author:
Carter
Publisher:
McGraw Hill


Functions and Change: A Modeling Approach to Coll…
Algebra
ISBN:
9781337111348
Author:
Bruce Crauder, Benny Evans, Alan Noell
Publisher:
Cengage Learning

Glencoe Algebra 1, Student Edition, 9780079039897…
Algebra
ISBN:
9780079039897
Author:
Carter
Publisher:
McGraw Hill


Algebra and Trigonometry (MindTap Course List)
Algebra
ISBN:
9781305071742
Author:
James Stewart, Lothar Redlin, Saleem Watson
Publisher:
Cengage Learning
