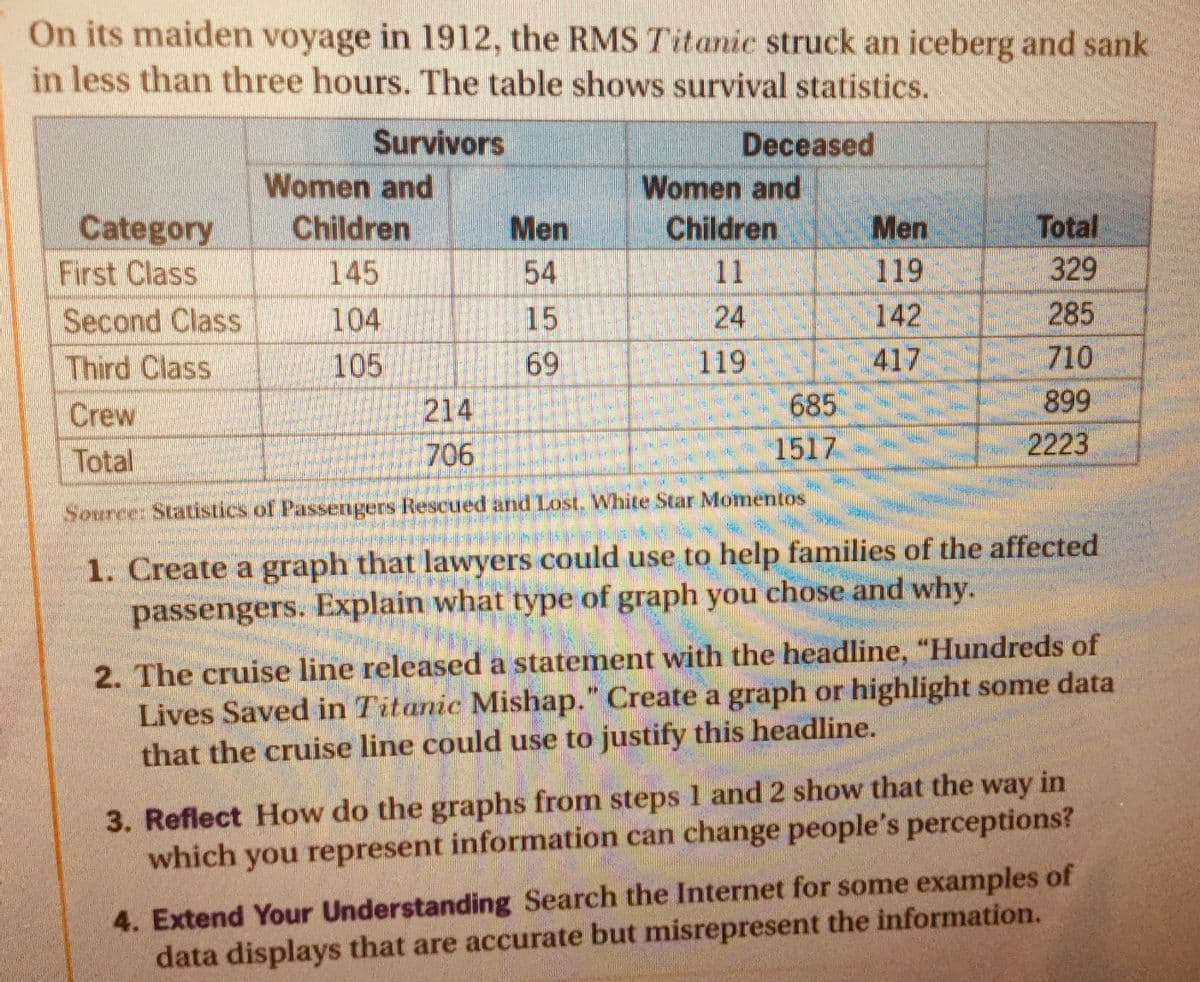
On its maiden voyage in 1912, the RMS Titanic struck an iceberg and sank in less than three hours. The table shows survival statistics. Survivors Deceased Women and Women and Category First Class Children Men Children Men Total 145 54 11 119 329 Second Class 104 15 24 142 285 Third Class 105 69 119 417 710 695 899
On its maiden voyage in 1912, the RMS Titanic struck an iceberg and sank in less than three hours. The table shows survival statistics. Survivors Deceased Women and Women and Category First Class Children Men Children Men Total 145 54 11 119 329 Second Class 104 15 24 142 285 Third Class 105 69 119 417 710 695 899

Glencoe Algebra 1, Student Edition, 9780079039897, 0079039898, 2018
18th Edition
ISBN:9780079039897
Author:Carter
Publisher:Carter
Chapter10: Statistics
Section10.6: Summarizing Categorical Data
Problem 10CYU

Related questions
Question
Transcribed Image Text:On its maiden voyage in 1912, the RMS Titanic struck an iceberg and sank
in less than three hours. The table shows survival statistics.
Survivors
Deceased
Women and
Children
11
Women and
Total
Category
First Class
Second Class
Third Class
Children
Men
Men
145
54
119
329
285
24
119
142
417
15
104
105
710
69
214
706
685
1517
899
Crew
Total
2223
Source: Statistics of Passengers Rescued and Lost, White Star Momentos
1. Create a graph that lawyers could use to help families of the affected
passengers. Explain what type of graph you chose and why.
2. The cruise line released a statement with the headline, "Hundreds of
Lives Saved in Titanic Mishap." Create a graph or highlight some data
that the cruise line could use to justify this headline.
3. Reflect How do the graphs from steps 1 and 2 show that the way in
which you represent information can change people's perceptions?
4. Extend Your Understanding Search the Internet for some examples of
data displays that are accurate but misrepresent the information.
Expert Solution
This question has been solved!
Explore an expertly crafted, step-by-step solution for a thorough understanding of key concepts.

Step by step
Solved in 2 steps

Recommended textbooks for you
Glencoe Algebra 1, Student Edition, 9780079039897…
Algebra
ISBN:
9780079039897
Author:
Carter
Publisher:
McGraw Hill
Glencoe Algebra 1, Student Edition, 9780079039897…
Algebra
ISBN:
9780079039897
Author:
Carter
Publisher:
McGraw Hill