(d) Because of increased competition, Deegan is considering reducing the price of model DRB such that the new contribution to profit is $175 per unit. How would this change in price affect the optimal solution? Explain. The objective coefficient range for model DRB shows a lower limit of $ $ . Thus, the optimal solution --Select--- change and the new value will be (e) If the available manufacturing time is increased by 500 hours, will the dual value for the manufacturing time constraint change? Explain. The allowable increase is minutes, so the dual value for this constraint ---Select--- change.
(d) Because of increased competition, Deegan is considering reducing the price of model DRB such that the new contribution to profit is $175 per unit. How would this change in price affect the optimal solution? Explain. The objective coefficient range for model DRB shows a lower limit of $ $ . Thus, the optimal solution --Select--- change and the new value will be (e) If the available manufacturing time is increased by 500 hours, will the dual value for the manufacturing time constraint change? Explain. The allowable increase is minutes, so the dual value for this constraint ---Select--- change.

Practical Management Science
6th Edition
ISBN:9781337406659
Author:WINSTON, Wayne L.
Publisher:WINSTON, Wayne L.
Chapter6: Optimization Models With Integer Variables
Section: Chapter Questions
Problem 48P

Related questions
Question
Please answer D & E.
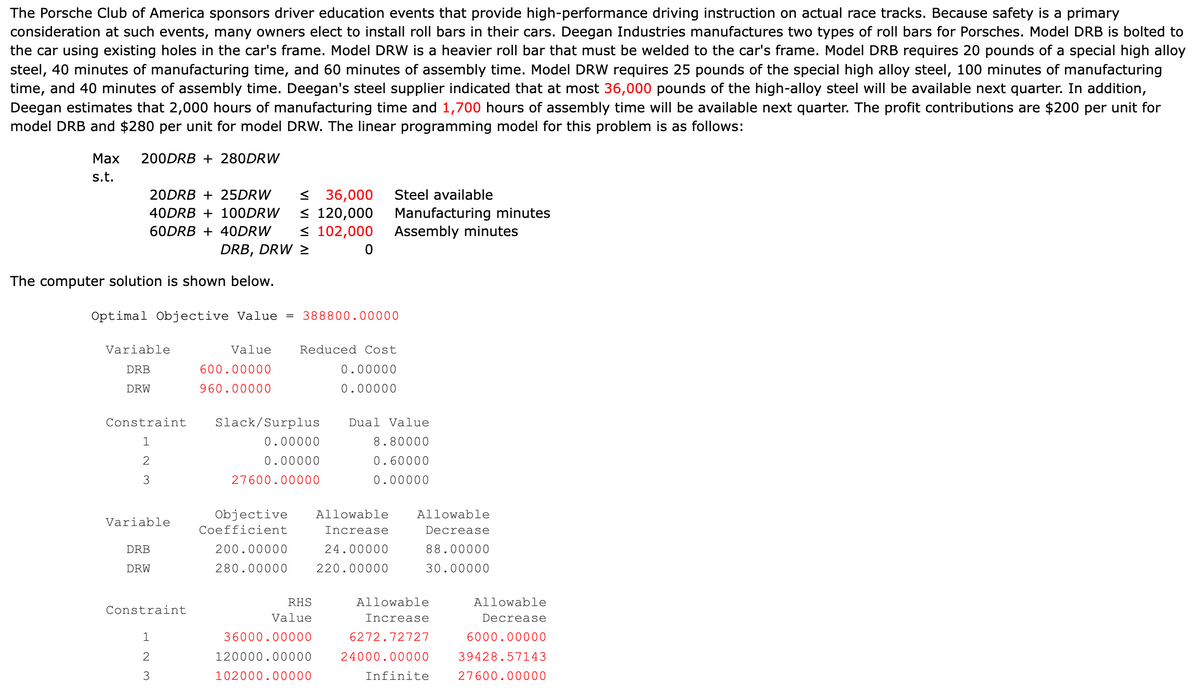
Transcribed Image Text:The Porsche Club of America sponsors driver education events that provide high-performance driving instruction on actual race tracks. Because safety is a primary
consideration at such events, many owners elect to install roll bars in their cars. Deegan Industries manufactures two types of roll bars for Porsches. Model DRB is bolted to
the car using existing holes in the car's frame. Model DRW is a heavier roll bar that must be welded to the car's frame. Model DRB requires 20 pounds of a special high alloy
steel, 40 minutes of manufacturing time, and 60 minutes of assembly time. Model DRW requires 25 pounds of the special high alloy steel, 100 minutes of manufacturing
time, and 40 minutes of assembly time. Deegan's steel supplier indicated that at most 36,000 pounds of the high-alloy steel will be available next quarter. In addition,
Deegan estimates that 2,000 hours of manufacturing time and 1,700 hours of assembly time will be available next quarter. The profit contributions are $200 per unit for
model DRB and $280 per unit for model DRW. The linear programming model for this problem is as follows:
Max
s.t.
200DRB + 280DRW
The computer solution is shown below.
20DRB + 25DRW
40DRB + 100DRW
60DRB + 40DRW
DRB, DRW >
Variable
DRB
DRW
Optimal Objective Value = 388800.00000
Constraint
1
2
3
Variable
DRB
DRW
Constraint
1
2
W N
3
≤36,000
≤ 120,000
≤ 102,000
0
Value
600.00000
960.00000
Slack/Surplus
Reduced Cost
0.00000
0.00000
0.00000
0.00000
27600.00000
200.00000
280.00000
Steel available
Manufacturing minutes
Assembly minutes
Objective Allowable Allowable
Coefficient
Decrease
Increase
24.00000
88.00000
220.00000
30.00000
RHS
Value
36000.00000
120000.00000
102000.00000
Dual Value
8.80000
0.60000
0.00000
Allowable
Increase
6272.72727
24000.00000
Infinite
Allowable
Decrease
6000.00000
39428.57143
27600.00000
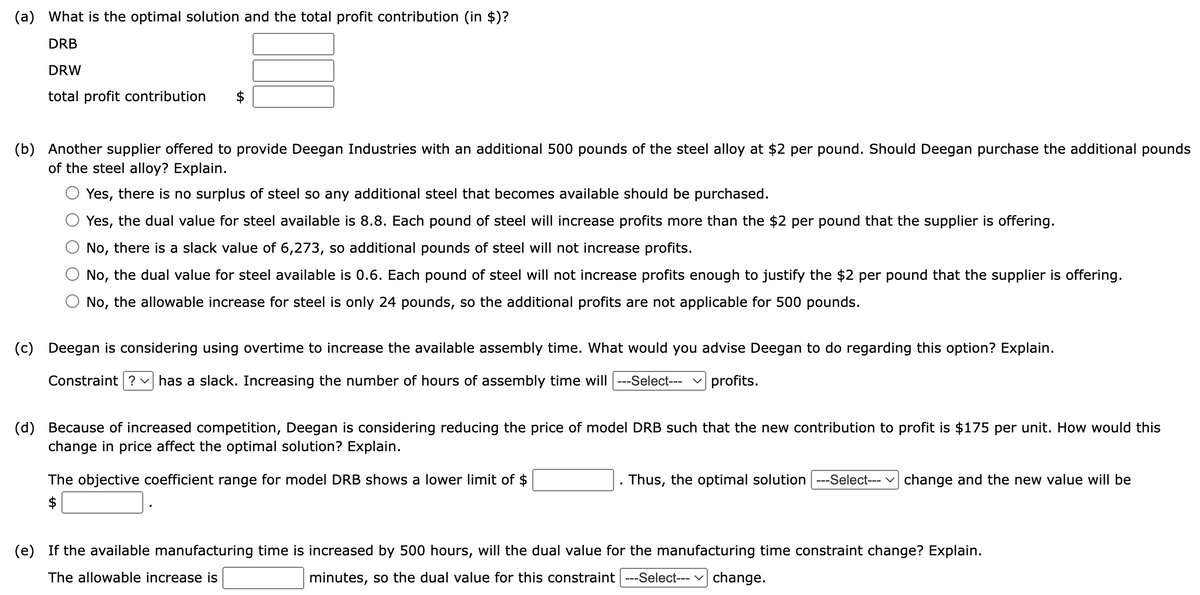
Transcribed Image Text:(a) What is the optimal solution and the total profit contribution (in $)?
DRB
DRW
total profit contribution
(b) Another supplier offered to provide Deegan Industries with an additional 500 pounds of the steel alloy at $2 per pound. Should Deegan purchase the additional pounds
of the steel alloy? Explain.
Yes, there is no surplus of steel so any additional steel that becomes available should be purchased.
Yes, the dual value for steel available is 8.8. Each pound of steel will increase profits more than the $2 per pound that the supplier is offering.
No, there is a slack value of 6,273, so additional pounds of steel will not increase profits.
No, the dual value for steel available is 0.6. Each pound of steel will not increase profits enough to justify the $2 per pound that the supplier is offering.
No, the allowable increase for steel is only 24 pounds, so the additional profits are not applicable for 500 pounds.
(c) Deegan is considering using overtime to increase the available assembly time. What would you advise Deegan to do regarding this option? Explain.
Constraint ? ✓ has a slack. Increasing the number of hours of assembly time will |---Select--- profits.
(d) Because of increased competition, Deegan is considering reducing the price of model DRB such that the new contribution to profit is $175 per unit. How would this
change in price affect the optimal solution? Explain.
The objective coefficient range for model DRB shows a lower limit of $
$
Thus, the optimal solution ---Select--- change and the new value will be
(e) If the available manufacturing time is increased by 500 hours, will the dual value for the manufacturing time constraint change? Explain.
The allowable increase is
minutes, so the dual value for this constraint ---Select--- ✓ change.
Expert Solution
This question has been solved!
Explore an expertly crafted, step-by-step solution for a thorough understanding of key concepts.

This is a popular solution!

Trending now
This is a popular solution!

Step by step
Solved in 3 steps with 2 images

Follow-up Questions
Read through expert solutions to related follow-up questions below.
Follow-up Question
On part D, the $600 was wrong. Is there another possible solution?
Solution
Recommended textbooks for you
Practical Management Science
Operations Management
ISBN:
9781337406659
Author:
WINSTON, Wayne L.
Publisher:
Cengage,
Practical Management Science
Operations Management
ISBN:
9781337406659
Author:
WINSTON, Wayne L.
Publisher:
Cengage,