On the following graph, plot Jacques's demand for scented candles using the green points (triangle symbol). Next, plot Kyoko's demand for scented candles using the purple points (diamond symbol). Finally, plot the market demand for scented candles using the blue points (circle symbol). PHICE (Dolars per candle) 3 S A Jacques's Demand Kyoko's Demand 8 Market Demand
On the following graph, plot Jacques's demand for scented candles using the green points (triangle symbol). Next, plot Kyoko's demand for scented candles using the purple points (diamond symbol). Finally, plot the market demand for scented candles using the blue points (circle symbol). PHICE (Dolars per candle) 3 S A Jacques's Demand Kyoko's Demand 8 Market Demand

Chapter3: Market Demand And Supply
Section: Chapter Questions
Problem 4SQ

Related questions
Question
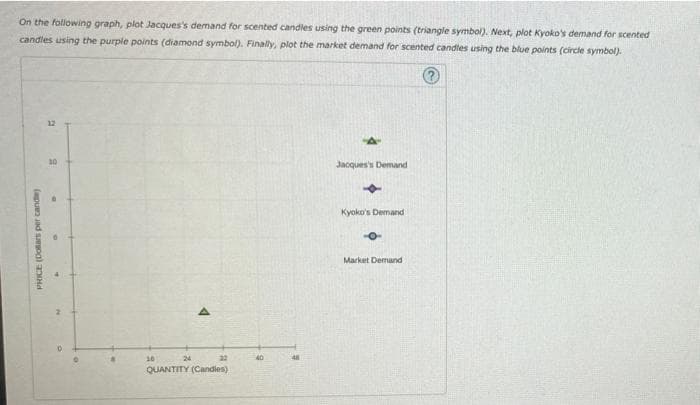
Transcribed Image Text:On the following graph, plot Jacques's demand for scented candles using the green points (triangle symbol). Next, plot Kyoko's demand for scented
candles using the purple points (diamond symbol). Finally, plot the market demand for scented candles using the blue points (circle symbol).
PRICE (Dollars per candle)
12
30
B
T
2
O
10
24
22
QUANTITY (Candies),
9
48
A
Jacques's Demand
4
Kyoko's Demand
8
Market Demand
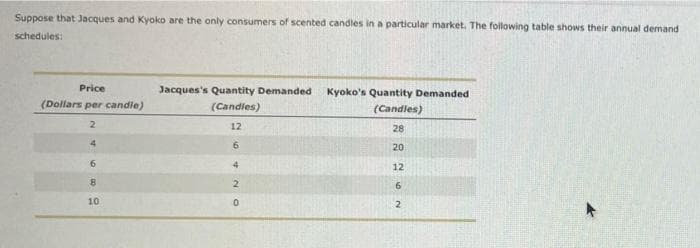
Transcribed Image Text:Suppose that Jacques and Kyoko are the only consumers of scented candles in a particular market. The following table shows their annual demand
schedules:
Price
(Dollars per candle)
2
4
6
8
10
Jacques's Quantity Demanded Kyoko's Quantity Demanded
(Candies)
(Candles)
12
28
6
20
4
12
2
6
0
2
Expert Solution
This question has been solved!
Explore an expertly crafted, step-by-step solution for a thorough understanding of key concepts.

This is a popular solution!

Trending now
This is a popular solution!

Step by step
Solved in 2 steps with 1 images

Knowledge Booster


Learn more about
Need a deep-dive on the concept behind this application? Look no further. Learn more about this topic, economics and related others by exploring similar questions and additional content below.Recommended textbooks for you


Economics (MindTap Course List)
Economics
ISBN:
9781337617383
Author:
Roger A. Arnold
Publisher:
Cengage Learning