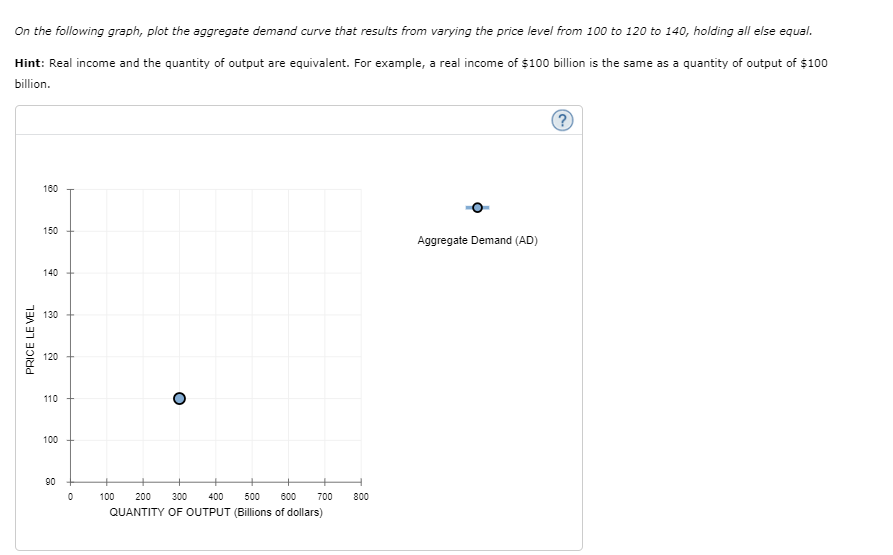
On the following graph, plot the aggregate demand curve that results from varying the price level from 100 to 120 to 140, holding all else equal. Hint: Real income and the quantity of output are equivalent. For example, a real income of $100 billion is the same as a quantity of output of $100 billion. 180 150 Aggregate Demand (AD) 140 130 120 110 100 90 100 200 300 400 500 600 700 800 QUANTITY OF OUTPUT (Billions of dollars) PRICE LE VEL
On the following graph, plot the aggregate demand curve that results from varying the price level from 100 to 120 to 140, holding all else equal. Hint: Real income and the quantity of output are equivalent. For example, a real income of $100 billion is the same as a quantity of output of $100 billion. 180 150 Aggregate Demand (AD) 140 130 120 110 100 90 100 200 300 400 500 600 700 800 QUANTITY OF OUTPUT (Billions of dollars) PRICE LE VEL
Chapter9: Aggregate Demand
Section: Chapter Questions
Problem 6.13P
Related questions
Question

Transcribed Image Text:On the following graph, plot the aggregate demand curve that results from varying the price level from 100 to 120 to 140, holding all else equal.
Hint: Real income and the quantity of output are equivalent. For example, a real income of $100 billion is the same as a quantity of output of $100
billion.
160
150
Aggregate Demand (AD)
140
130
120
110
100
90
100
200
300
400
500
600
700
800
QUANTITY OF OUTPUT (Billions of dollars)
PRICE LE VEL

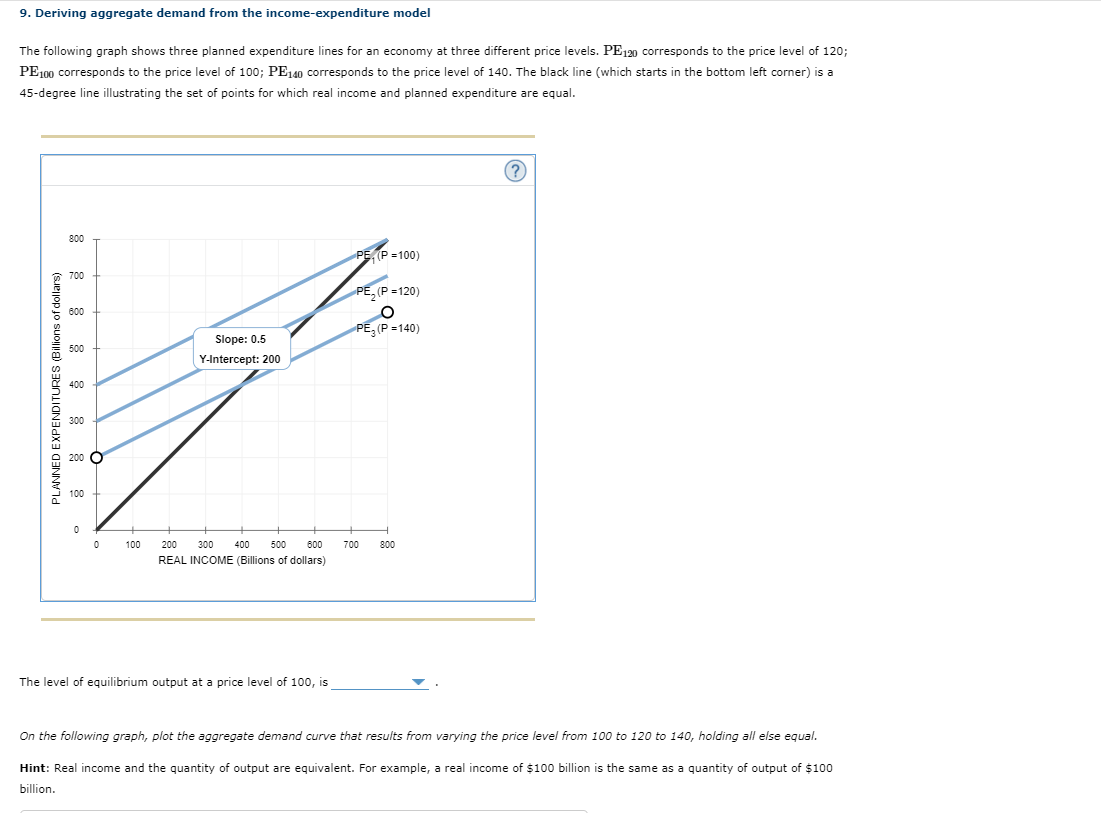
Transcribed Image Text:9. Deriving aggregate demand from the income-expenditure model
The following graph shows three planned expenditure lines for an economy at three different price levels. PE120 corresponds to the price level of 120;
PE100 corresponds to the price level of 100; PE140 corresponds to the price level of 140. The black line (which starts in the bottom left corner) is a
45-degree line illustrating the set of points for which real income and planned expenditure are equal.
800
PE, (P = 100)
700
PE, (P =120)
600
PE, (P =140)
Slope: 0.5
500
Y-Intercept: 200
400
300
100
100
200
300
400
500
600
700
800
REAL INCOME (Billions of dollars)
The level of equilibrium output at a price level of 100, is
On the following graph, plot the aggregate demand curve that results from varying the price level from 100 to 120 to 140, holding all else equal.
Hint: Real income and the quantity of output are equivalent. For example, a real income of $100 billion is the same as a quantity of output of $100
billion.
PLANNED EXPENDITURES (Billions of dollars)
Expert Solution
This question has been solved!
Explore an expertly crafted, step-by-step solution for a thorough understanding of key concepts.
This is a popular solution!
Trending now
This is a popular solution!
Step by step
Solved in 2 steps with 1 images

Knowledge Booster
Learn more about
Need a deep-dive on the concept behind this application? Look no further. Learn more about this topic, economics and related others by exploring similar questions and additional content below.Recommended textbooks for you


Principles of Economics 2e
Economics
ISBN:
9781947172364
Author:
Steven A. Greenlaw; David Shapiro
Publisher:
OpenStax


Principles of Economics 2e
Economics
ISBN:
9781947172364
Author:
Steven A. Greenlaw; David Shapiro
Publisher:
OpenStax