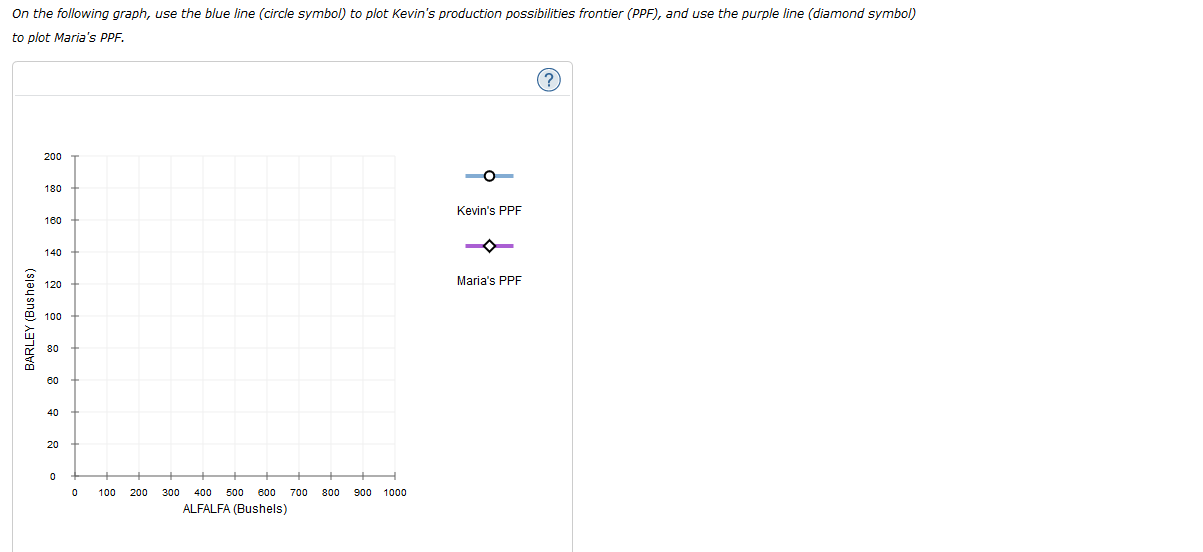
On the following graph, use the blue line (circle symbol) to plot Kevin's production possibilities frontier (PPF), and use the purple line (diamond symbol) to plot Maria's PPF Kevin's PPF Maria's PPF 0 400 500 600 900 1000 100 200 300 700 800 ALFALFA (Bushels) BARLEY (Bushels)
On the following graph, use the blue line (circle symbol) to plot Kevin's production possibilities frontier (PPF), and use the purple line (diamond symbol) to plot Maria's PPF Kevin's PPF Maria's PPF 0 400 500 600 900 1000 100 200 300 700 800 ALFALFA (Bushels) BARLEY (Bushels)

Chapter2: Productions Possibilities, Opportunity Costs, And Economic Growth
Section: Chapter Questions
Problem 7SQP

Related questions
Question
Kevin and Maria are farmers. Each one owns a 20-acre plot of land. The following table shows the amount of alfalfa and barley each farmer can produce per year on a given acre. Each farmer chooses whether to devote all acres to producing alfalfa or barley or to produce alfalfa on some of the land and barley on the rest.
Alfalfa Barley
|
(Bushels per acre)
|
(Bushels per acre)
|
|
|---|---|---|
| Kevin | 40 | 8 |
| Maria | 28 | 7 |
Transcribed Image Text:On the following graph, use the blue line (circle symbol) to plot Kevin's production possibilities frontier (PPF), and use the purple line (diamond symbol)
to plot Maria's PPF
Kevin's PPF
Maria's PPF
0
400 500 600
900 1000
100
200
300
700
800
ALFALFA (Bushels)
BARLEY (Bushels)
Expert Solution
This question has been solved!
Explore an expertly crafted, step-by-step solution for a thorough understanding of key concepts.

This is a popular solution!

Trending now
This is a popular solution!

Step by step
Solved in 3 steps with 3 images

Knowledge Booster


Learn more about
Need a deep-dive on the concept behind this application? Look no further. Learn more about this topic, economics and related others by exploring similar questions and additional content below.Recommended textbooks for you


Essentials of Economics (MindTap Course List)
Economics
ISBN:
9781337091992
Author:
N. Gregory Mankiw
Publisher:
Cengage Learning
Essentials of Economics (MindTap Course List)
Economics
ISBN:
9781337091992
Author:
N. Gregory Mankiw
Publisher:
Cengage Learning

Brief Principles of Macroeconomics (MindTap Cours…
Economics
ISBN:
9781337091985
Author:
N. Gregory Mankiw
Publisher:
Cengage Learning

