On the following graph, use the purple line (diamond symbol) to draw the Kazakhstan's supply curve including the quota SK+Q. (Hint: Draw this as a straight line even though this curve should be equivalent to the domestic supply curve below the world price.) Then use the grey line (star symbol) to indicate the new price of grapes with a quota of 60,000 grapes.
On the following graph, use the purple line (diamond symbol) to draw the Kazakhstan's supply curve including the quota SK+Q. (Hint: Draw this as a straight line even though this curve should be equivalent to the domestic supply curve below the world price.) Then use the grey line (star symbol) to indicate the new price of grapes with a quota of 60,000 grapes.

Principles of Microeconomics
7th Edition
ISBN:9781305156050
Author:N. Gregory Mankiw
Publisher:N. Gregory Mankiw
Chapter9: Application: International Trade
Section: Chapter Questions
Problem 8PA

Related questions
Question
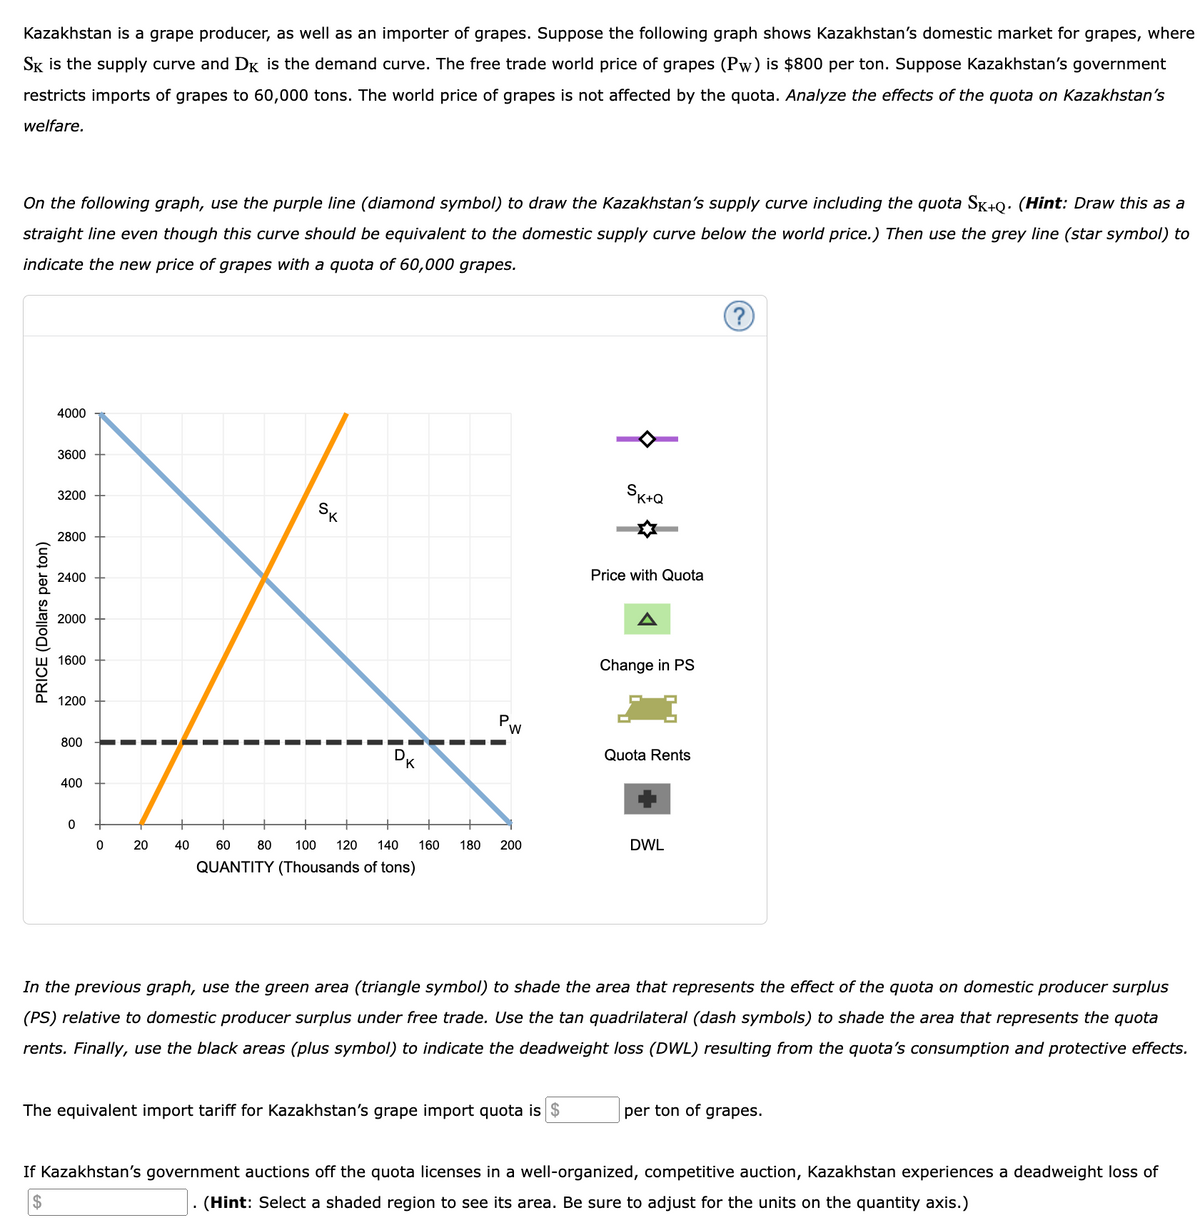
Transcribed Image Text:Kazakhstan is a grape producer, as well as an importer of grapes. Suppose the following graph shows Kazakhstan's domestic market for grapes, where
SK is the supply curve and DK is the demand curve. The free trade world price of grapes (Pw) is $800 per ton. Suppose Kazakhstan's government
restricts imports of grapes to 60,000 tons. The world price of grapes is not affected by the quota. Analyze the effects of the quota on Kazakhstan's
welfare.
On the following graph, use the purple line (diamond symbol) to draw the Kazakhstan's supply curve including the quota Sk+Q. (Hint: Draw this as a
straight line even though this curve should be equivalent to the domestic supply curve below the world price.) Then use the grey line (star symbol) to
indicate the new price of grapes with a quota of 60,000 grapes.
PRICE (Dollars per ton)
4000
3600
3200
2800
2400
2000
1600
1200
800
400
0
0
20
SK
K
P
W
40 60 80 100 120 140 160 180 200
QUANTITY (Thousands of tons)
SK+Q
The equivalent import tariff for Kazakhstan's grape import quota is $
Price with Quota
Change in PS
Quota Rents
DWL
?
In the previous graph, use the green area (triangle symbol) to shade the area that represents the effect of the quota on domestic producer surplus
(PS) relative to domestic producer surplus under free trade. Use the tan quadrilateral (dash symbols) to shade the area that represents the quota
rents. Finally, use the black areas (plus symbol) to indicate the deadweight loss (DWL) resulting from the quota's consumption and protective effects.
per ton of grapes.
If Kazakhstan's government auctions off the quota licenses in a well-organized, competitive auction, Kazakhstan experiences a deadweight loss of
$
(Hint: Select a shaded region to see its area. Be sure to adjust for the units on the quantity axis.)
Expert Solution
This question has been solved!
Explore an expertly crafted, step-by-step solution for a thorough understanding of key concepts.

Step by step
Solved in 3 steps with 2 images

Knowledge Booster


Learn more about
Need a deep-dive on the concept behind this application? Look no further. Learn more about this topic, economics and related others by exploring similar questions and additional content below.Recommended textbooks for you
Principles of Microeconomics
Economics
ISBN:
9781305156050
Author:
N. Gregory Mankiw
Publisher:
Cengage Learning

Principles of Macroeconomics (MindTap Course List)
Economics
ISBN:
9781285165912
Author:
N. Gregory Mankiw
Publisher:
Cengage Learning

Principles of Economics, 7th Edition (MindTap Cou…
Economics
ISBN:
9781285165875
Author:
N. Gregory Mankiw
Publisher:
Cengage Learning
Principles of Microeconomics
Economics
ISBN:
9781305156050
Author:
N. Gregory Mankiw
Publisher:
Cengage Learning
Principles of Macroeconomics (MindTap Course List)
Economics
ISBN:
9781285165912
Author:
N. Gregory Mankiw
Publisher:
Cengage Learning
Principles of Economics, 7th Edition (MindTap Cou…
Economics
ISBN:
9781285165875
Author:
N. Gregory Mankiw
Publisher:
Cengage Learning


Economics (MindTap Course List)
Economics
ISBN:
9781337617383
Author:
Roger A. Arnold
Publisher:
Cengage Learning