ONLY QUESTION 3******


Q: Let x and y be the sample means for two variable x and y. The centered x-data and the centered…
A: Correlation is the measures to used to determine the association between the two variable. It used…
Q: Which of the following is TRUE about W? ANOVA Regression W Total df SS 1 8 9 2335 MS 140.1 F p-value…
A: Anova is the inferential method. Here we compare more than three groups means. It is the extension…
Q: Find the area of the shaded region under the standard normal distribution between the given…
A: Normal distribution: Normal distribution is a continuous probability distribution and it is called…
Q: The flow rate y (m³/min) in a device used for air-quality measurement depends on the pressure drop x…
A: “Since you have posted a question with multiple sub-parts, we will solve first three sub-parts for…
Q: The local seven-digit telephone numbers in city A have 334 as the first three digits. How many…
A:
Q: A sample mean, sample standard deviation, and sample size are given. Use the one-mean t-test to…
A: Given: Sample mean x¯= 3.13 s = 0.59 n = 9 α =…
Q: acteria that grows to 30 in 8 minutes. How long will it take for there to be 250 bacteria? Round
A: The exponential growth model is used to find population growth in living organisms These systems…
Q: The annual salary for one particular occupation is normally distributed, with a mean of about…
A: We have given that Mean(µ) = 134000 Standard deviations (σ) = 21000And, n = 35
Q: 4. In this example we have coded measurements on a dependent variable y, and two controlled…
A: Given data: Test 1 Y X1 X2 1 1.6 1 1 2 2.1 1 2 3 2.4 2 1 4 2.8 2 2 5 3.6 2 3 6 3.8 3…
Q: A sample of size 190 will be drawn from a population with mean 45 and standard deviation 11. Use the…
A: Probability: Probability is the measurement of the probability that an event will occur in a Random…
Q: A newspaper in a large Midwestern city reported that the National Association of Realtors said that…
A: Givensample size(n)=63Mean(x)=118900standard deviation(σ)=3700significance level(α)=0.05
Q: Students A B C D E F G H I J K L Grade (x) 84 87 90 91 88 75 91 85 85 90 82 78 GWA (y) 1.75 2.00…
A: Regression Equation: The Regression Equation is used to predict the response or dependent variable y…
Q: A regression was run to determine if there is a relationship between hours of study per week (x) and…
A: Given that y=ax+b a = 5.235 b = 21.73 r ^2 = 0.36 r = 0.6
Q: Q13. What happens to the standard error of an estimate when the sample size in a random sample SRS)…
A:
Q: Given the following of a school with only grade 9 and 10 Grade 9's Grade 10's Totals Completed no…
A: Odds measure the favorable cases with the non favorable cases. Probability measure the uncertainty.…
Q: The following data represent the pH of rain for a random sample of 12 rain dates. A normal…
A: “Since you have posted a question with multiple sub-parts, we will solve the first three sub-parts…
Q: rtilizer: In an agricultural experiment, the effects of two fertilizers on the production of oranges…
A: Given, In an agricultural experiment, the effects of two fertilizers on the production of oranges…
Q: The test statistic of z = 1.82 is obtained when testing the claim that p # 0.674. a. Identify the…
A: It is given that Test statistic, z = 1.82 Claim: p ≠ 0.674
Q: Suppose that f(x,y)= [15x²y ; 0<x<y<1 0; otherwise.
A:
Q: • Example 2: A group of physicians specializing in weight loss is interested in knowing whether…
A:
Q: Describe the statistical methods and statistical techniques listed below. For each of these…
A: Marketing opportunities are instances in favor of a company to sell something to a certain type of…
Q: The overhead reach distances of adult females are normally distributed with a mean of 202.5 cm and a…
A: Normal distribution is the type of continuous distribution. It distribute the data in bell shaped…
Q: Directions. Test the significance of the following correlation coefficients. 3. -0.58 4. 0.63 5.…
A: Hypotheses: H0: ρ=0H1: ρ≠0
Q: Example 1: Recent research suggests that a pregnancy within less than two years of a live birth…
A: Given: Sample size n = 15 Significance level α = 0.10 Formula Used: Test-statistic t = d-μdsdn…
Q: Using the z table (The Standard Normal Distribution Table), find the critical value (or values)…
A: From given dataα=0.07
Q: 13. Using Matrix approach, compute F - value. 0.9421 *
A: Formula for F value: F=Mean sum of squares for regressionMean of squares for error…
Q: Probabilities of different types of vehicle-to-vehicle accidents are shown below: Accident…
A: Given, Accident Probability Car to Car 0.01 Car to Truck 0.19 Truck to Truck…
Q: Breathe deeply: Breathing rates, in breaths per minute, were measured for a group of ten subjects at…
A: The calculation and answer given in the steps below. Thanks!
Q: The table below show data that has been collected from different fields from various farms in a…
A: General form of regression equation is as follows , y=b1x+b0 Where , y is dependent variable x…
Q: What is the P VALUE? H(0) P= .68 H(A) P> .68 Sample size of 46. 63 People were surveyed. 48…
A: Given: X = 48 n = 63 P = 0.68 Formula Used: p-value = P(Z≥z) Z = p^-PP(1-P)n p^ = Xn
Q: The monthly utility bills in a city are normally distributed, with a mean of $100 and a standard…
A:
Q: From the parameter estimation output, which of the following is TRUE? Intercept Diameter of granules…
A: It is given that Y-intercept = -2.47 Slope = 17.16
Q: Suppose that one in six smartphone users have fallen prey to cyber-attack. We use a sample of 200…
A:
Q: How is ANOVA similar to and different from a t-test? Why is it best not to perform multiple t-tests…
A: The answers of the questions are given below. Thanks!
Q: A regression was run to determine if there is a relationship between hours of TV watched per day (x)…
A: The following information has been given: x→hours of TV watched per day. y→number of sit ups a…
Q: Approximately 50% of all student loans guaranteed by the government are in default. A random sample…
A: The hypotheses for the test are given below. Null hypothesis: H0: p = 0.50 Alternative hypothesis:…
Q: Consider this scatterplot: 100 80 60 40 20 20 How many outliers are present? OO 2 4 5 40 60 80
A:
Q: 16. A sample mean, sample standard deviation, and sample size are given. Use the one-mean t-test to…
A: Given,sample mean(x¯)=7.1sample standard deviation(s)=2.3sample size(n)=18degrees of…
Q: Suppose that X, Y, and Z are jointly distributed random variables, that is, they are defined on the…
A:
Q: (c) Compute the expected frequencies. Grade Expected Part: 3 / 9 Part 4 of 9 A Grade A B C D F 18 B…
A:
Q: Directions. Test the significance of the following correlation coefficients. 3. -0.58 4. 0.63 5.…
A: Correlation is the measure of inferential statistic. It measure the association between the two…
Q: A study was done on proctored and nonproctored tests. The results are shown in the table. Assume…
A: From the given information we have For Proctored Sample size (n1) = 32 Sample mean (x̅1) = 78.75…
Q: Classify the data as either discrete or continuous. The number of freshmen entering college in a…
A: A variable is said to be disctete if it takes specific values like integers or whole numbers like…
Q: Estimate the output of the company in 1965. auk oda ni ogr Mooo nouris
A:
Q: Assume that a randomly selected subject is given a bone density test. Those test scores are normally…
A: It is given that the test scores follow normal distribution with mean 0 and the standard deviation…
Q: 6. The following data resulted from an experiment to compare three burners, B₁, B₂ and B3. A Latin…
A: Given data: Engine 1 Engine 2 Engine 3 Day 1 B1 16 B2 17 B3 20 Day 2 B2 16 B3…
Q: An engineer is going to redesign an ejection seat for an airplane. The seat was designed for pilots…
A: The mean is 157 and the standard deviation is 26.1.
Q: From the scatter plot, which of the following is FALSE? Bicarbonate (parts per million) 250 200 150…
A: We know that regression Hypothesis H0: β1 = 0 HA: β1 ≠ 0 That means the larger the distance…
Q: The test statistic of z = 1.26 is obtained when testing the claim that p > 0.2. a. Identify the…
A: Given: Test statistic (z)= 1.26 Alternative hypothesis: Ha:p>0.2
Q: Two of the five (5) foreign automobiles from an overseas shipment have slight paint blemishes. If an…
A: From given data: Total no. of automobiles =5 B=blemished N=Non-blemished There is 7, not 8 elements…
*****ONLY QUESTION 3******

Step by step
Solved in 2 steps with 1 images

- A Bitter Dispute With the publication of Ars Magna, a dispute intensified between Jerome Cardan and another mathematician named Niceolo Fontana, otherwise known as Tartaglia. What was the dispute, and how did it arise? In your opinion, who was at fault? Write a paragraph or two about your findings.Sale Price 12400 10400 12100 10000 11000 8895 7675 9975 6350 10470 9895 11250 8795 12500 9340 10150 9200 9395 11000 10640 10000 7500 8000 10440 10200 10300 9740 9280 10930 8000 9000 7680 9400 10730 7350 12240 11970 8240 9910 10080 9440 8970 9500 10050 10130 11400 8500 7500 9090 10500 According to the National Automobile Dealers Association, the mean price for used cars is $10,192. A manager of a Kansas City used car dealership reviewed a sample of 50 recent used car sales at the dealership in an attempt to determine whether the population mean price for used cars at this particular dealership differed from the national mean. The prices for the sample of 50 cars are shown in the file named UsedCars. Formulate the hypotheses that can be used to determine whether a difference exists in the mean price for used cars at the dealership. What is the p-value? At , what is your conclusion?Sale Price 9950 6536 11554 10049 11542 9339 11022 9858 6863 10912 12028 7661 10783 8959 6602 10123 10234 7104 8970 8490 9682 8208 9496 8352 12003 12260 12824 9733 10592 12232 13010 11725 6700 13104 11166 12684 12293 8152 7110 11255 8361 11550 9871 6634 11298 7594 6258 9413 10991 9304
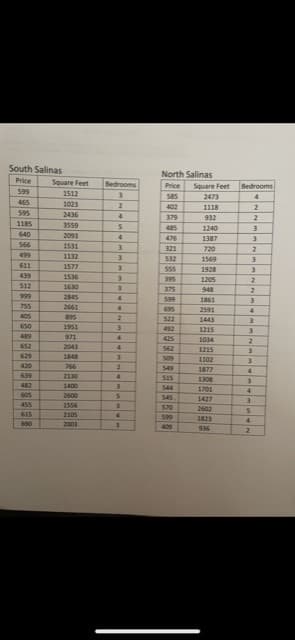
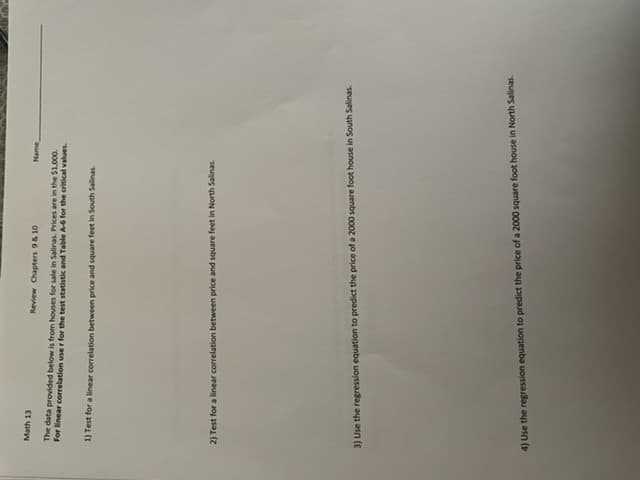
- 775 1065 896 930 1052 846 949 797 1041 962 1028 910 1067 982 879 1097 1071 1056 1021 928 1045 974 1112 975 887 1069 1040 927 867 864 983 987 906 1030 934 662 1004 901 1123 1033 1028 934 1148 1027 978 1139 1078 1088 948 912 942 860 822 911 938 1000 944 980 915 899 852 989 978 991 996 878 833 865 1069 779 960 907 1009 1118 903 957 1014 885 947 1006 1036 824 866 860 986 972 916 991 851 1050 980 983 977 864 903 940 995 842 1122 1036 The table above represents the average rent for 100 randomly selected U.S. cities. According to www.apartments.com, the average rent for a two-bedroom apartment in the city of Napa is $1,967. How do other U.S. cities’ rents compare to Napa? Are they about the same, on average, or are rents significantly lower elsewhere? 1) To test this hypothesis, two…775 1065 896 930 1052 846 949 797 1041 962 1028 910 1067 982 879 1097 1071 1056 1021 928 1045 974 1112 975 887 1069 1040 927 867 864 983 987 906 1030 934 662 1004 901 1123 1033 1028 934 1148 1027 978 1139 1078 1088 948 912 942 860 822 911 938 1000 944 980 915 899 852 989 978 991 996 878 833 865 1069 779 960 907 1009 1118 903 957 1014 885 947 1006 1036 824 866 860 986 972 916 991 851 1050 980 983 977 864 903 940 995 842 1122 1036 The above table represents the average rent for 100 randomly selected U.S. cities. According to www.apartments.com, the average rent for a two-bedroom apartment in the city of Napa is $1,967. How do other U.S. cities’ rents compare to Napa? Are they about the same, on average, or are rents significantly lower elsewhere? 1) Set up the hypotheses (null and…NORTH–SOUTH AIRLINE CASENorthern Airline DataAirframe CostEngine CostAverage AgeYearper Aircraftper Aircraft(Hours)200151.8043.496,512200254.9238.588,404200369.7051.4811,077200468.9058.7211,717200563.7245.4713,2752006 84.7350.2615,215200778.7479.6018,390Southeast Airline DataAirframe CostEngine CostAverage AgeYearPer Aircraftper Aircraft(Hours)200113.2918.865,107200225.1531.558,145200332.1840.437,360200431.7822.105,773200525.3419.697,150200632.7832.589,364200735.5638.078,2591. Develop Regression equations for each cost category as dependent variables and average age as independent variables. Do this for each Airline. Look at graphs produced by QM2. From the regression results, what would you conclude about a) airframe vs engine costs for each airlineb) comparing airlines as to airframe costsc) comparing airlines as to engine costsd) Provide a brief summary report of your comparisons
- Company Competitor 1383 1153 2022 1067 2429 1296 901 1406 2219 1254 1896 1335 1910 1204 1539 1076 2048 1246 2881 1098 2395 1258 1349 955 2052 954 2675 1363 1588 1022 2704 1155 3148 1807 2822 1295 2217 1116 2260 1323 3040 1326 3137 1107 2977 1163 2599 1254 2412 1017 3187 938 2598 1270 2995 1042 3046 1318 3858 1497 2438 750 3243 1380 2764 1053 2944 932 3324 1097 2797 1193 3914 1271 2766 843 2273 780 3052 1095 3202 1290 3672 937 3957 1390 3274 1056 3788 1235 3502 1235 2942 999 3078 1066 3196 641 3141 1322 3579 1289 3895 1060 above is the excel data, please solve the excel part with formulas and explanation, thanks68 Sample data:0.7100.7400.6400.3900.7002.2001.9800.6401.2200.2001.6401.3302.9500.9001.7601.0101.2600.0000.6501.4601.6201.8300.9901.5600.4101.2800.8301.3400.5401.2500.9201.0000.7800.7901.4401.0002.2402.5001.7901.2501.4900.8401.4201.0001.2501.4201.3500.9300.4001.390ZIP Code Population Season Pass Holders 45220 14171 224 45219 17576 42 45225 13437 15 45217 5731 78 45214 9952 19 45232 6913 28 45223 13349 83 45229 15713 75 45206 11353 69 45202 15105 83 45203 3411 9 45207 8233 8 41074 5566 36 41073 6193 63 45224 21043 207 41071 21596 133 45205 21683 102 45204 6642 36 41016 5603 42 45216 9028 55 45212 22356 207 41011 25849 193 41014 7913 41 45237 21137 86 45208 18236 424 45211 33968 342 45239 26485 269 41075 15868 236 45209 8941 111 45226 5029 84 45238 42737 564 45231 39939 361 45213 11683 153 45215 28915 308 45218 3917 54 41017 40218 493 41076 14779 176 45251 22887 205 45227 18431 215 45247 20372 357 41015 22298 189 45248 22880 380 45236 21823 310 45240 27033 142 45246 13522 100 45230 25763 423 45233 14175 244 45252 4799 58 41018 29001 244 45243 14755 303 45241 25623 299 45014 44178 307 45242 20015 377 45244 26316 448 41059 2266 22 41048…
- PART E PLEASE claims age 3367 50 1094 38 766 34 1725 43 2837 48 2844 48 3692 51 594 31 3049 49 3041 49 3078 49 1897 44 5272 55 1587 42 2804 48 1254 40 1170 39 2312 46 4517 53 596 31 4838 54 2784 48 534 30 1167 39 1862 44 2811 48 768 34 1084 38 3674 51 783 34 917 36 653 32 4861 54 3358 50 1420 41 2569 47 3327 50 2052 45 2318 46 1097 38 840 35 834 35 541 30 1737 43 4111 52 1745 43 3319 50 3683 51 5285 55 2818 48 1857 44 592 31 3709 51 2028 45 4538 53 5322 55 1404 41 1192 39 647 32 3335 50 3304 50 533 30 543 30 842 35 1884 44 5298 55 1000 37 602 31 777 34 1186 39 935 36 649 32 4506 53 650 32 785 34 710 33 2290 46 536 30 4150 52 1893 44 922 36 656 32 704 33 540 30 2285 46 1081 38 712 33 4560 53 1164 39 705 33 1880 44 937 36 4475 53 1009 37 850 35 930 36 848 35 1557 42 1175 39 1576 42 1572…Adams County, Nebraska 33,024 31,126 31,181 31,299 31,367 31,396 Antelope County, Nebraska 6,729 6,742 6,697 6,655 6,600 6,531 Arthur County, Nebraska 364 426 448 490 507 476 Banner County, Nebraska 824 720 703 778 816 788 Blaine County, Nebraska 471 539 585 584 586 594 Boone County, Nebraska 5,531 5,553 5,512 5,473 5,441 5,404 Box Butte County, Nebraska 11,031 11,372 11,383 11,345 11,312 11,308 Boyd County, Nebraska 2,120 2,107 2,095 2,025 2,093 2,067 Brown County, Nebraska 3,178 3,192 3,153 3,183 3,167 3,090 Buffalo County, Nebraska 44,877 45,437 45,842 46,330 46,885 47,388 Burt County, Nebraska 7,047 6,964 6,901 6,829 6,748 6,690 Butler County, Nebraska 8,416 8,382 8,360 8,345 8,334 8,312 Cass County, Nebraska 25,495 25,246 25,230 25,214 25,222 25,315 Cedar County, Nebraska 8,582 8,906 8,839 8,807 8,790 8,736 Chase County, Nebraska 3,702 3,927 3,937 3,964 3,984 3,990 Cherry County, Nebraska 5,682 5,783 5,750 5,722 5,735 5,749 Cheyenne County, Nebraska…Wages LOS 48.3355 94 49.0279 48 40.8817 102 36.5854 20 46.7596 60 59.5238 78 39.1304 45 39.2465 39 40.2037 20 38.1563 65 50.0905 76 46.9043 48 43.1894 61 60.5637 30 97.6801 70 48.5795 108 67.1551 61 38.7847 10 51.8926 68 51.8326 54 64.1026 24 54.9451 222 43.8095 58 43.3455 41 61.9893 153 40.0183 16 50.7143 43 48.84 96 34.3407 98 80.5861 150 33.7163 124 60.3792 60 48.84 7 38.5579 22 39.276 57 47.6564 78 44.6864 36 45.7875 83 65.6288 66 33.5775 47 41.2088 97 67.9096 228 43.0942 27 40.7 48 40.5748 7 39.6825 74 50.1742 204 54.9451 24 32.3822 13 51.713 30 55.8379 95 54.9451 104 70.2786 34 57.2344 184 54.1126 156 39.8687 25 27.4725 43 67.9584 36 44.9317 60 51.5612 102 This is the data given to us